
MATLAB: An Introduction with Applications
6th Edition
ISBN: 9781119256830
Author: Amos Gilat
Publisher: John Wiley & Sons Inc
expand_more
expand_more
format_list_bulleted
Related questions
Question
Please help with part c. The first picture has all of the data.
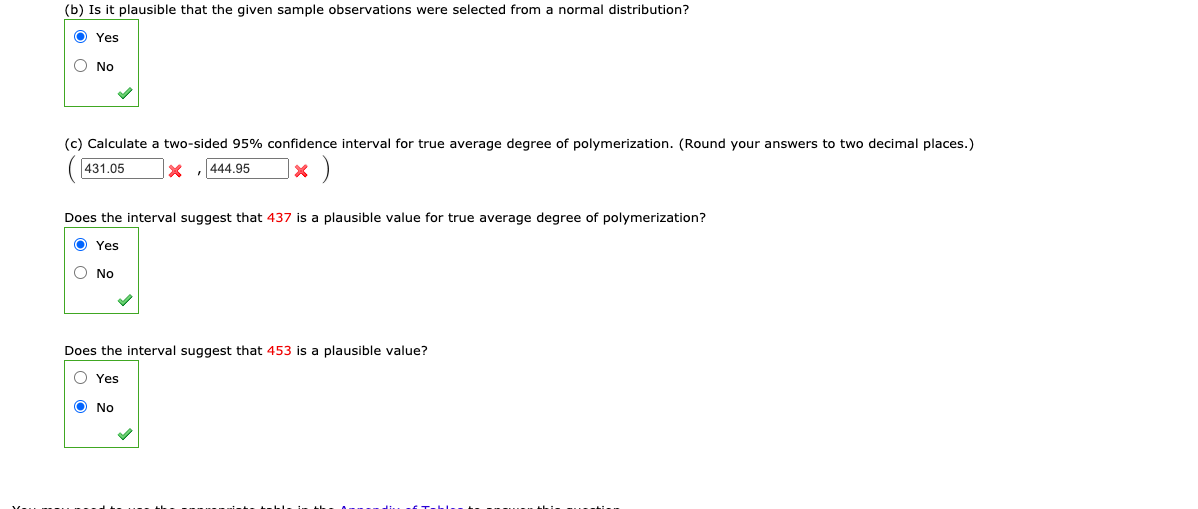

Transcribed Image Text:(b) Is it plausible that the given sample observations were selected from a normal distribution?
O Yes
O No
(c) Calculate a two-sided 95% confidence interval for true average degree of polymerization. (Round your answers to two decimal places.)
431.05
,444.95
Does the interval suggest that 437 is a plausible value for true average degree of polymerization?
O Yes
O No
Does the interval suggest that 453 is a plausible value?
O Yes
O No

Transcribed Image Text:An article contained the following observations on degree of polymerization for paper specimens for which viscosity times concentration fell in a certain middle range:
416 420 422 423 426 427 430 434 436
439 445 446 449 452 454 462 465
(a) Construct a boxplot of the data.
420
430
440
450
460
420
430
440
450
460
420
430
440
450
460
420
430
440
450
Comment on any interesting features. (Select all that apply.)
Expert Solution
This question has been solved!
Explore an expertly crafted, step-by-step solution for a thorough understanding of key concepts.

This is a popular solution

Trending nowThis is a popular solution!

Step by stepSolved in 2 steps

Knowledge Booster


Learn more about
Need a deep-dive on the concept behind this application? Look no further. Learn more about this topic, statistics and related others by exploring similar questions and additional content below.Similar questions
- Please help on this question. Please show all steps.arrow_forwardMake a table of the most useful variables. Select an appropriate graph type and make a graph using two variables from this data set. Explain why you selected the variables you did and which is the dependent and which is the independent variable.arrow_forwardA sports equipment manufacturer has developed a new reasonably priced golf ball that it hopes will allow average golfers to hit the ball straighter. A concern is that this new technology might impact on the distance that the ball travels. To compare distances, Sarah, a company researcher, conducts an experiment where 20 current balls and 20 new balls are subjected to distance tests, using a mechanical hitting device for consistency. The results of the tests, with distances given to the nearest metre, are given in Table 1. Table 1 Distances travelled by golf balls Current golf ball New golf ball 299 292 292 291 293 285 295 288 283 273 280 305 280 286 311 308 292 291 283 296 292 294 309 281 311 286 302 302 294 296 297 303 287 298 282 293 300 290 297 284arrow_forward
- Window Below are two snapshots of data taken from the covid19.nj.gov website on January 8, 2021. What information can you take away from these graphs? Can the graphs be compared? What might be confusing or misleading about the information? What could you do to better present the information?arrow_forwardHow would you graph this?arrow_forwardClassify the data as either discrete or continuous.The number of freshmen entering college in a certain year is 621. Group of answer choices Discrete Continuousarrow_forward
- The mean of the data set {9,5, y, 2, x} is twice the data set {8, x, 4,1,3}. What is (y- x)2?arrow_forwardMrs. Alexander had her chemistry classes analyze the amount of time it takes for water to evaporate out of different-sized containers. The graph below shows a line of best fit for the data collected by all of her students.arrow_forwardOnly data that shows positive trends can be graphed in a scatter diagram. True O Falsearrow_forward
arrow_back_ios
SEE MORE QUESTIONS
arrow_forward_ios
Recommended textbooks for you
- MATLAB: An Introduction with ApplicationsStatisticsISBN:9781119256830Author:Amos GilatPublisher:John Wiley & Sons Inc
 Probability and Statistics for Engineering and th...StatisticsISBN:9781305251809Author:Jay L. DevorePublisher:Cengage Learning
 Statistics for The Behavioral Sciences (MindTap C...StatisticsISBN:9781305504912Author:Frederick J Gravetter, Larry B. WallnauPublisher:Cengage Learning
  Elementary Statistics: Picturing the World (7th E...StatisticsISBN:9780134683416Author:Ron Larson, Betsy FarberPublisher:PEARSON
 The Basic Practice of StatisticsStatisticsISBN:9781319042578Author:David S. Moore, William I. Notz, Michael A. FlignerPublisher:W. H. Freeman
 Introduction to the Practice of StatisticsStatisticsISBN:9781319013387Author:David S. Moore, George P. McCabe, Bruce A. CraigPublisher:W. H. Freeman
MATLAB: An Introduction with Applications
Statistics
ISBN:9781119256830
Author:Amos Gilat
Publisher:John Wiley & Sons Inc
Probability and Statistics for Engineering and th...
Statistics
ISBN:9781305251809
Author:Jay L. Devore
Publisher:Cengage Learning
Statistics for The Behavioral Sciences (MindTap C...
Statistics
ISBN:9781305504912
Author:Frederick J Gravetter, Larry B. Wallnau
Publisher:Cengage Learning
Elementary Statistics: Picturing the World (7th E...
Statistics
ISBN:9780134683416
Author:Ron Larson, Betsy Farber
Publisher:PEARSON
The Basic Practice of Statistics
Statistics
ISBN:9781319042578
Author:David S. Moore, William I. Notz, Michael A. Fligner
Publisher:W. H. Freeman
Introduction to the Practice of Statistics
Statistics
ISBN:9781319013387
Author:David S. Moore, George P. McCabe, Bruce A. Craig
Publisher:W. H. Freeman