
MATLAB: An Introduction with Applications
6th Edition
ISBN: 9781119256830
Author: Amos Gilat
Publisher: John Wiley & Sons Inc
expand_more
expand_more
format_list_bulleted
Related questions
Question
I only need help with Part C.
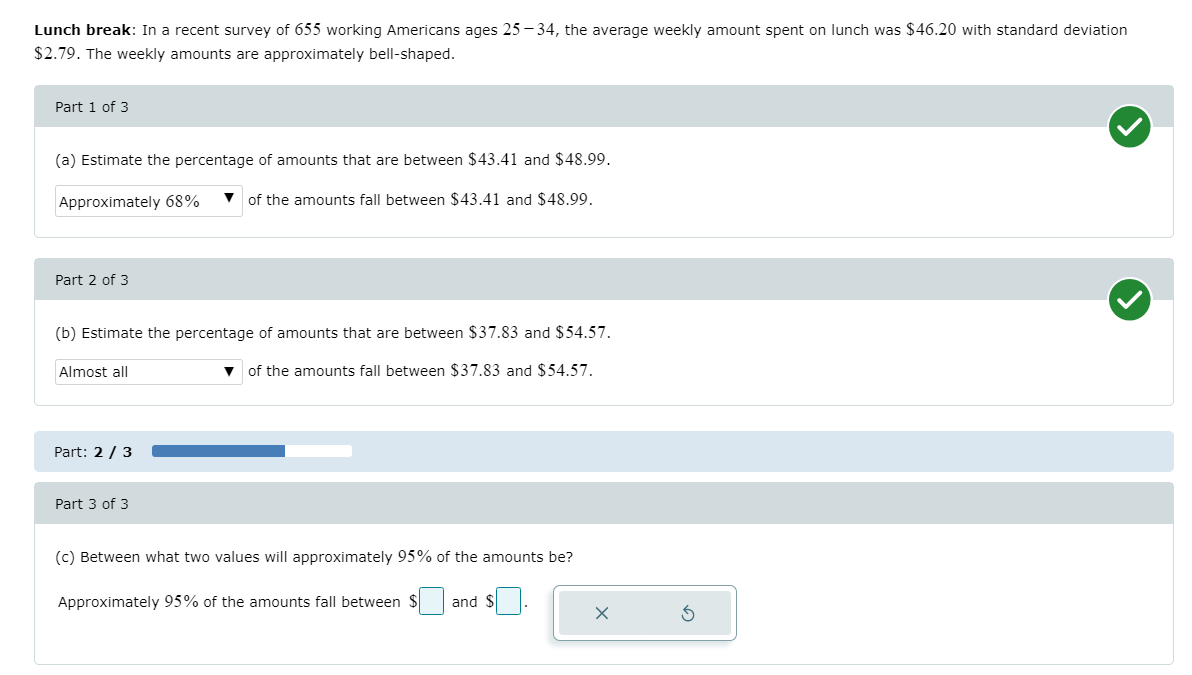

Transcribed Image Text:Lunch break: In a recent survey of 655 working Americans ages 25 - 34, the average weekly amount spent on lunch was $46.20 with standard deviation
$2.79. The weekly amounts are approximately bell-shaped.
Part 1 of 3
(a) Estimate the percentage of amounts that are between $43.41 and $48.99.
Approximately 68%
of the amounts fall between $43.41 and $48.99.
Part 2 of 3
(b) Estimate the percentage of amounts that are between $37.83 and $54.57.
Almost all
of the amounts fall between $37.83 and $54.57.
Part: 2/ 3
Part 3 of 3
(c) Between what two values will approximately 95% of the amounts be?
Approximately 95% of the amounts fall between $
and $
Expert Solution
This question has been solved!
Explore an expertly crafted, step-by-step solution for a thorough understanding of key concepts.

This is a popular solution

Trending nowThis is a popular solution!

Step by stepSolved in 2 steps with 1 images

Knowledge Booster

Similar questions
- I already have a,b,c and d. I just need help on E, F, G, and Harrow_forwardPart 4: Suppose that 53 of the 55 Computer Science students of San Sebastian College, Manila are taking at least one of the mathematics subjects Algebra, Trigonometry and Calculus. See the figure below for more details: 24 taking Algebra, 26 taking Trigonometry, 20 taking Calculus, 5 taking Algebra and Trigonometry, 7 taking Algebra and Calculus, 8 taking Trigonometry and Calculus. a. Find the number of students who are taking all three mäthematics subjects. b. Fill in the correct number of students in each of the eight regions of the Venn diagram. c. Determine the number of students who are not taking any of the three mathematics subjects? d. How many students are taking Algebra as their only mathematics subject? e. How many students were taking Calculus and Trigonometry but not Algebra?arrow_forwardIn step 1, I don't understand how b is an element of only H and not k. Please let me know. Thank youarrow_forward
Recommended textbooks for you
- MATLAB: An Introduction with ApplicationsStatisticsISBN:9781119256830Author:Amos GilatPublisher:John Wiley & Sons Inc
 Probability and Statistics for Engineering and th...StatisticsISBN:9781305251809Author:Jay L. DevorePublisher:Cengage Learning
 Statistics for The Behavioral Sciences (MindTap C...StatisticsISBN:9781305504912Author:Frederick J Gravetter, Larry B. WallnauPublisher:Cengage Learning
  Elementary Statistics: Picturing the World (7th E...StatisticsISBN:9780134683416Author:Ron Larson, Betsy FarberPublisher:PEARSON
 The Basic Practice of StatisticsStatisticsISBN:9781319042578Author:David S. Moore, William I. Notz, Michael A. FlignerPublisher:W. H. Freeman
 Introduction to the Practice of StatisticsStatisticsISBN:9781319013387Author:David S. Moore, George P. McCabe, Bruce A. CraigPublisher:W. H. Freeman
MATLAB: An Introduction with Applications
Statistics
ISBN:9781119256830
Author:Amos Gilat
Publisher:John Wiley & Sons Inc
Probability and Statistics for Engineering and th...
Statistics
ISBN:9781305251809
Author:Jay L. Devore
Publisher:Cengage Learning
Statistics for The Behavioral Sciences (MindTap C...
Statistics
ISBN:9781305504912
Author:Frederick J Gravetter, Larry B. Wallnau
Publisher:Cengage Learning
Elementary Statistics: Picturing the World (7th E...
Statistics
ISBN:9780134683416
Author:Ron Larson, Betsy Farber
Publisher:PEARSON
The Basic Practice of Statistics
Statistics
ISBN:9781319042578
Author:David S. Moore, William I. Notz, Michael A. Fligner
Publisher:W. H. Freeman
Introduction to the Practice of Statistics
Statistics
ISBN:9781319013387
Author:David S. Moore, George P. McCabe, Bruce A. Craig
Publisher:W. H. Freeman