
Related questions
Concept explainers
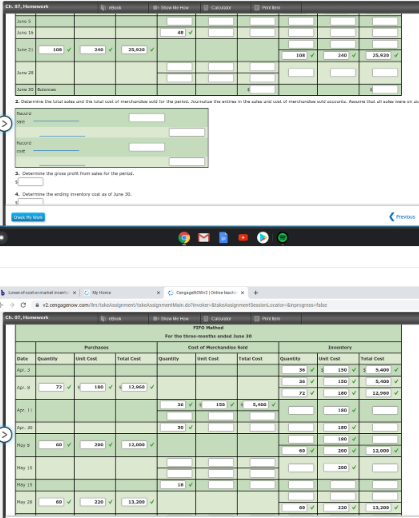
FIFO Perpetual Inventory
The beginning inventory of merchandise at Dunne Co. and data on purchases and sales for a three-month period ending June 30 are as follows:
| Date | Transaction | Number of Units |
Per Unit | Total | ||||
| Apr. 3 | Inventory | 36 | $150 | $5,400 | ||||
| 8 | Purchase | 72 | 180 | 12,960 | ||||
| 11 | Sale | 48 | 500 | 24,000 | ||||
| 30 | Sale | 30 | 500 | 15,000 | ||||
| May 8 | Purchase | 60 | 200 | 12,000 | ||||
| 10 | Sale | 36 | 500 | 18,000 | ||||
| 19 | Sale | 18 | 500 | 9,000 | ||||
| 28 | Purchase | 60 | 220 | 13,200 | ||||
| June 5 | Sale | 36 | 525 | 18,900 | ||||
| 16 | Sale | 48 | 525 | 25,200 | ||||
| 21 | Purchase | 108 | 240 | 25,920 | ||||
| 28 | Sale | 54 | 525 | 28,350 |
Required:
1. Record the inventory, purchases, and cost of merchandise sold data in a perpetual inventory record similar to the one illustrated in Exhibit 3, using the first-in, first-out method. Under FIFO, if units are in inventory at two different costs, enter the units with the LOWER unit cost first in the Cost of Merchandise Sold Unit Cost column and in the Inventory Unit Cost column.
| Dunne Co. Schedule of Cost of Merchandise Sold FIFO Method For the three-months ended June 30 |
|||||||||
| Purchases | Cost of Merchandise Sold | Inventory | |||||||
| Date | Quantity | Unit Cost | Total Cost | Quantity | Unit Cost | Total Cost | Quantity | Unit Cost | Total Cost |
| Apr. 3 | fill in the blank 1 | $fill in the blank 2 | $fill in the blank 3 | ||||||
| Apr. 8 | fill in the blank 4 | $fill in the blank 5 | $fill in the blank 6 | fill in the blank 7 | fill in the blank 8 | fill in the blank 9 | |||
| fill in the blank 10 | fill in the blank 11 | fill in the blank 12 | |||||||
| Apr. 11 | fill in the blank 13 | $fill in the blank 14 | $fill in the blank 15 | fill in the blank 16 | fill in the blank 17 | fill in the blank 18 | |||
| fill in the blank 19 | fill in the blank 20 | fill in the blank 21 | |||||||
| Apr. 30 | fill in the blank 22 | fill in the blank 23 | fill in the blank 24 | fill in the blank 25 | fill in the blank 26 | fill in the blank 27 | |||
| May 8 | fill in the blank 28 | fill in the blank 29 | fill in the blank 30 | fill in the blank 31 | fill in the blank 32 | fill in the blank 33 | |||
| fill in the blank 34 | fill in the blank 35 | fill in the blank 36 | |||||||
| May 10 | fill in the blank 37 | fill in the blank 38 | fill in the blank 39 | fill in the blank 40 | fill in the blank 41 | fill in the blank 42 | |||
| fill in the blank 43 | fill in the blank 44 | fill in the blank 45 | |||||||
| May 19 | fill in the blank 46 | fill in the blank 47 | fill in the blank 48 | fill in the blank 49 | fill in the blank 50 | fill in the blank 51 | |||
| May 28 | fill in the blank 52 | fill in the blank 53 | fill in the blank 54 | fill in the blank 55 | fill in the blank 56 | fill in the blank 57 | |||
| fill in the blank 58 | fill in the blank 59 | fill in the blank 60 | |||||||
| June 5 | fill in the blank 61 | fill in the blank 62 | fill in the blank 63 | fill in the blank 64 | fill in the blank 65 | fill in the blank 66 | |||
| June 16 | fill in the blank 67 | fill in the blank 68 | fill in the blank 69 | fill in the blank 70 | fill in the blank 71 | fill in the blank 72 | |||
| June 21 | fill in the blank 73 | fill in the blank 74 | fill in the blank 75 | fill in the blank 76 | fill in the blank 77 | fill in the blank 78 | |||
| fill in the blank 79 | fill in the blank 80 | fill in the blank 81 | |||||||
| June 28 | fill in the blank 82 | fill in the blank 83 | fill in the blank 84 | fill in the blank 85 | fill in the blank 86 | fill in the blank 87 | |||
| fill in the blank 88 | fill in the blank 89 | fill in the blank 90 | |||||||
| June 30 | Balances | $fill in the blank 91 | $fill in the blank 92 |
2. Determine the total sales and the total cost of merchandise sold for the period.
| Record sale | fill in the blank 94 | ||
| fill in the blank 96 | |||
| Record cost | fill in the blank 98 | ||
| fill in the blank 100 |
3. Determine the gross profit from sales for the period.
$fill in the blank 101
4. Determine the ending inventory cost as of June 30.
$fill in the blank 102
5. Based upon the preceding data, would you expect the inventory using the last-in, first-out method to be higher or lower?


Trending nowThis is a popular solution!

Step by stepSolved in 4 steps


- Perpetual inventory using FIFO The following units of a particular item were available for sale during the calendar year: Jan. 1 Inventory 3,800 units at $39 Apr. 19 Sale 2,000 units June 30 Purchase 4,300 units at $42 Sept. 2 Sale 5,300 units Nov. 15 Purchase 2,000 units at $43 The firm maintains a perpetual inventory system. Determine the cost of goods sold for each sale and the inventory balance after each sale, assuming the first-in, first-out method. Present the data in the form illustrated in Exhibit 3. Under FIFO, if units are in inventory at two different costs, enter the units with the LOWER unit cost first in the Cost of Goods Sold Unit Cost column and in the Inventory Unit Cost column. Round your answers for quantity values to the nearest whole number, for unit cost values to the nearest cent, and for total cost values to the nearest dollar. Schedule of Cost of Goods SoldFIFO Method Purchases Cost of Goods Sold Inventory…arrow_forwardPerpetual Inventory Using FIFO Beginning inventory, purchases, and sales for Item Delta are as follows: July 1 Inventory 50 units at $15 7 Sale 44 units 15 Purchase 90 units at $18 24 Sale 40 units Assuming a perpetual inventory system and using the first-in, first-out (FIFO) method, determine (a) the cost of merchandise sold on July 24 and (b) the inventory on July 31. a. Cost of merchandise sold on July 24 $fill in the blank 1 b. Inventory on July 31 $fill in the blank 2arrow_forwardPeriodic Inventory by Three Methods The units of an item available for sale during the year were as follows: 6 units at $31 16 units at $33 Jan. 1 Inventory Feb. 17 Purchase Jul. 21 Purchase Nov. 23 Purchase 16 units at $36 20 units at $37 There are 6 units of the item in the physical inventory at December 31. The periodic inventory system is used. Round average unit cost to the nearest cent and final answers to the nearest whole dollar, if required. a. Determine the inventory cost by the first-in, first-out method. $ b. Determine the inventory cost by the last-in, first-out method. c. Determine the inventory cost by the weighted average cost method. Round average unit cost to the two decimal places, and round your final answer to the nearest dollar.arrow_forward
- Perpetual Inventory Using LIFO The following units of a particular item were available for sale during the calendar year: Jan. 1 Inventory 4,000 units at $40 Apr. 19 Sale 2,500 units June 30 Purchase 4,500 units at $44 Sept. 2 Sale 5,000 units Nov. 15 Purchase 2,000 units at $46 The firm maintains a perpetual inventory system. Determine the cost of goods sold for each sale and the inventory balance after each sale, assuming the last-in, first-out method. Present the data in the form illustrated in Exhibit 4. Under LIFO, if units are in inventory at two or more different costs, enter the units with the LOWER unit cost first in the Inventory Unit Cost column. Schedule of Cost of Goods Sold LIFO Method Purchases Cost of Goods Sold Inventory Date Quantity Unit Cost Total Cost Quantity Unit Cost Total Cost Quantity Unit Cost Total Cost Jan. 1 160,000 Apr. 19 2,500 40 60,000 June 30 4,500 44 198,000 Sept. 2 Nov. 15 2,000 46 92,000 Dec. 31 Balancesarrow_forwardPeriodic Inventory-FIFO Carla Company uses the perpetual inventory system. The following information is available for January of the current year when Carla sold 1,600 units of inventory on January 14. Units Cost/Unit TotalCost Inventory, Jan. 1 1,500 $0.25 $375 Purchases, Jan. 13 1,100 0.27 297 2,600 $672 Using the FIFO method, calculate Carla's cost of goods sold for January and its January 31 inventory. Cost of goods sold Ending inventoryarrow_forwardPeriodic inventory by three methods The beginning inventory at Midnight Supplies and data on purchases and sales for a three-month period ending March 31 are as follows: Number Date Transaction of Units Per Unit Total Jan. 1 Inventory Jan. 10 Purchase Jan. 28 Sale Jan. 30 Sale Feb. 5 Sale Feb. 10 Purchase Feb. 16 Sale Feb. 28 Sale Mar. 5 Purchase Mar. 14 Sale Mar. 25 Purchase Mar. 30 Sale 9,000 $60.00 $540,000 21,000 70.00 1,470,000 10,250 140.00 1,435,000 5,750 140.00 805,000 3,500 140.00 490,000 39,500 75.00 2,962,500 15,000 150.00 2,250,000 10,000 150.00 1,500,000 25,000 82.00 2,050,000 30,000 150.00 4,500,000 10,000 88.40 884,000 19,000 150.00 2,850,000 1. Determine the inventory on March 31 and the cost of goods sold for the three-month period, using the first-in, first-out method and the periodic inventory system. Inventory, March 31 $ 966,000 ✓ Cost of goods sold $ 6,940,500 2. Determine the inventory on March 31 and the cost of goods sold for the three-month period, using the…arrow_forward
- Inventory Turnover and Days Sales in Inventory Financial statement data for years ending December 31 for Amsterdam Company follow: 20Y4 2073 Cost of merchandise sold $3,598,900 $3,015,630 Inventories: Beginning of year 593,000 589,600 End of year 648,000 593,000 a. Determine the inventory turnover for 20Y4 and 20Y3. Round to one decimal place. Inventory Turnover 20Y4 20Y3 b. Determine the days' sales in inventory for 204 and 20Y. Assume 365 days a year. Round interim calculations and final answers to one decimal Days' Sales in Inventory 20Y4 ____ days 20Y3 ____ days c. Does the change in the inventory turnover and the days' sales in inventory from 20Y3 to 204 indicate a favorable or an unfavorable trend?arrow_forwardPerpetual Inventory Using FIFO ITE The following units of a particular item were available for sale during the calendar year: Jan. 1 Inventory 4,200 units at $39 Apr. 19 Sale 2,600 units June 30 Purchase 4,400 units at $44 Sept. 2 Sale 5,100 units Nov. 15 Purchase 2,100 units at $46 The firm maintains a perpetual inventory system. Determine the cost of goods sold for each sale and the inventory balance after each sale, assuming the first-in, first-out method. Present the data in the form illustrated in Exhibit 3. Under FIFO, if units are in inventory at two different costs, enter the units with the LOWER unit cost first in the Cost of Goods Sold Unit Cost column and in the Inventory Unit Cost column. Schedule of Cost of Goods Sold FIFO Method Purchases Cost of Goods Sold Inventory Date Quantity Unit Cost Total Cost Quantity Unit Cost Total Cost Quantity Unit Cost Total Cost Jan. 1 4,200 v 39 V $ 163,800 Apr. 19 2,600 $ 39 V $ 101,400 v 1,600 V June 30 4,400 44 $ 193,600 Sept. 2 900 V…arrow_forwardFIFO Perpetual Inventory The beginning inventory of merchandise at Rhodes Co. and data on purchases and sales for a three-month period ending June 30 are as follows: Date Transaction Numberof Units Per Unit Total Apr. 3 Inventory 42 $375 $15,750 8 Purchase 84 450 37,800 11 Sale 56 1,250 70,000 30 Sale 35 1,250 43,750 May 8 Purchase 70 500 35,000 10 Sale 42 1,250 52,500 19 Sale 21 1,250 26,250 28 Purchase 70 550 38,500 June 5 Sale 42 1,315 55,230 16 Sale 56 1,315 73,640 21 Purchase 126 600 75,600 28 Sale 63 1,315 82,845 Required: 1. Record the inventory, purchases, and cost of merchandise sold data in a perpetual inventory record similar to the one illustrated in Exhibit 3, using the first-in, first-out method. Under FIFO, if units are in inventory at two different costs, enter the units with the LOWER unit cost first in the Cost of Merchandise Sold Unit Cost…arrow_forward
- LIFO Perpetual Inventory The beginning inventory of merchandise at Dunne Co. and data on purchases and sales for a three-month period ending June 30 are as follows: Number Date Transaction Per Unit Total of Units Apr. 3 Inventory 42 $225 $9,450 Purchase 84 270 22,680 11 Sale 56 750 42,000 30 Sale 35 750 26,250 May 8 Purchase 70 300 21,000 10 Sale 42 750 31,500 19 Sale 21 750 15.750 28 Purchase 70 330 23,100 June 5 Sale 42 790 33.180 16 Sale 56 790 44,240 21 Purchase 126 360 45,360 28 Sale 63 790 49,770 Required: 1. Record the inventory, purchases, and cost of merchandise sold data in a perpetual inventory record similar to the one illustrated in Exhibit 4, using the last-in, first-out method. Under LIFO, if units are in inventory at two different costs, enter the units with the HIGHER unit cost first in the Cost of Merchandise Sold Unit Cost column and LOWER unit cost first in the Inventory Unit Cost column. Dunne Co. Schedule of Cost of Merchandise Sold LIFO Method For the…arrow_forwardPerpetual Inventory Using LIFO The following units of a particular item were available for sale during the calendar year: Jan. 1 Inventory 4,000 units at $20 Apr. 19 Sale 2,500 units June 30 Purchase 6,000 units at $24 Sept. 2 Sale 4,500 units Nov. 15 Purchase 1,000 units at $25 The firm maintains a perpetual inventory system. Determine the cost of merchandise sold for each sale and the inventory balance after each sale, assuming the last-in, first-out method. Present the data in the form illustrated in Exhibit 4. Under LIFO, if units are in inventory at two or more different costs, enter the units with the LOWER unit cost first in the Inventory Unit Cost column.arrow_forwardInventory turnover and number of days’ sales in inventory Financial statement data for years ending December 31 for Tango Company follow: Line Item Description 20Y7 20Y6 Cost of goods sold $3,784,320 $3,852,940 Inventories: Beginning of year 751,900 730,000 End of year 824,900 751,900 a. Determine the inventory turnover for 20Y7 and 20Y6. Round your answers to one decimal place. Line Item Description 20Y7 20Y6 Inventory turnover fill in the blank 1 of 2 fill in the blank 2 of 2 b. Determine the days’ sales in inventory for 20Y7 and 20Y6. Use 365 days a year. Round your answers to one decimal place. Line Item Description 20Y7 20Y6 Number of days’ sales in inventory fill in the blank 1 of 2 days fill in the blank 2 of 2 daysarrow_forward
 AccountingAccountingISBN:9781337272094Author:WARREN, Carl S., Reeve, James M., Duchac, Jonathan E.Publisher:Cengage Learning,
 Accounting Information SystemsAccountingISBN:9781337619202Author:Hall, James A.Publisher:Cengage Learning,
 Horngren's Cost Accounting: A Managerial Emphasis...AccountingISBN:9780134475585Author:Srikant M. Datar, Madhav V. RajanPublisher:PEARSON
 Intermediate AccountingAccountingISBN:9781259722660Author:J. David Spiceland, Mark W. Nelson, Wayne M ThomasPublisher:McGraw-Hill Education
 Financial and Managerial AccountingAccountingISBN:9781259726705Author:John J Wild, Ken W. Shaw, Barbara Chiappetta Fundamental Accounting PrinciplesPublisher:McGraw-Hill Education