
A First Course in Probability (10th Edition)
10th Edition
ISBN: 9780134753119
Author: Sheldon Ross
Publisher: PEARSON
expand_more
expand_more
format_list_bulleted
Related questions
Question
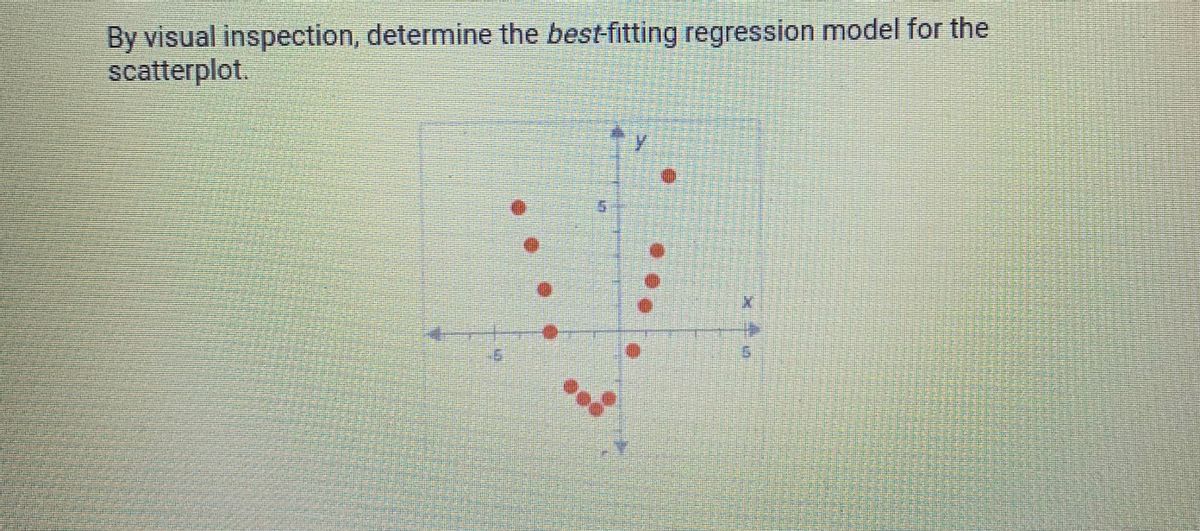

Transcribed Image Text:By visual inspection, determine the best-fitting regression model for the
scatterplot.

Transcribed Image Text:OA. Quadratic
O B. Linear
OC. No pattern
O D. Exponential
Expert Solution
This question has been solved!
Explore an expertly crafted, step-by-step solution for a thorough understanding of key concepts.

This is a popular solution

Trending nowThis is a popular solution!

Step by stepSolved in 2 steps with 2 images

Knowledge Booster

Similar questions
- You run a regression of homework grades on hours spent studying, and get the following regression equation: Grade = 94 – 6.2 * Hours_Spent_Studying + error What is your takeaway from this regression? Group of answer choices a) Studying is bad, and causes worse grades. b) Students don’t know how to study very well. c) A few outliers are skewing the results. d) Students who are less confident study more, but still do worse. There is an omitted variable skewing the results.arrow_forwardDescribe a hypothetical study for which multiple regression with more than two predictor variables would be an appropriate analysis. Your description should include one dependent variable and three or more predictors.arrow_forwardConsider a regression model. The coefficient of determination (R2) gives the proportion of the variability in the dependent variable that is explained by the regression equation. True Falsearrow_forward
- The applet displays a scatterplot with the following points: (7,10),(27,35),(24,25),(8,12),(10,19),(15,22). Identify the slope of the regression line, intercept of the regression line, and correlation coefficient. Report your answers accurate to within two decimal places.arrow_forwardResearchers are interested in predicting the height of a child based on the heights of their mother and father. Data were collected, which included height of the child ( height), height of the mother ( mothersheight ), and height of the father (fathersheight ). The initial analysis used the heights of the parents to predict the height of the child (all units are inches). The results of the analysis, a multiple regression, are presented below. . regress height mothersheight fathersheight Source Model Residual Total height mothersheight fathersheight _cons SS 208.008457 314.295372 522.303829 df 2 104.004228 8.49446952 37 MS 39 13.3924059 Coef. Std. Err. .6579529 .1474763 .2003584 .1382237 9.804327 12.39987 t P>|t| 4.46 0.000 C 0.156 0.79 0.434 Number of obs = F( 2, 37) = Prob > F R-squared Adj R-squared = Root MSE = = .3591375 -.0797093 -15.32021 = 40 12.24 0.0001 0.3983 0.3657 2.9145 [95% Conf. Interval] .9567683 .4804261 34.92886 What are the null and alternative hypotheses…arrow_forwardState whether the slope of a simple linear regression line is statistically significant, then the correlation will also always be significant?arrow_forward
- Using a sample of recent university graduates, you estimate a simple linear regression using initial annual salary as the dependent variable and the graduate's weighted average mark (WAM) as the explanatory variable. If the regression model has an estimated intercept of 3200 and an estimated slope coefficient of 550, what is the predicted starting salary of a student with a WAM of 64?arrow_forwardFind the least-squares regression line treating square footage as the explanatory variable. y = (Round the slope to three decimal places as needed. Round the intercept to one decimal place as needed.)arrow_forwardThe datasetBody.xlsgives the percent of weight made up of body fat for 100 men as well as other variables such as Age, Weight (lb), Height (in), and circumference (cm) measurements for the Neck, Chest, Abdomen, Ankle, Biceps, and Wrist. We are interested in predicting body fat based on abdomen circumference. Find the equation of the regression line relating to body fat and abdomen circumference. Make a scatter-plot with a regression line. What body fat percent does the line predict for a person with an abdomen circumference of 110 cm? One of the men in the study had an abdomen circumference of 92.4 cm and a body fat of 22.5 percent. Find the residual that corresponds to this observation. Bodyfat Abdomen 32.3 115.6 22.5 92.4 22 86 12.3 85.2 20.5 95.6 22.6 100 28.7 103.1 21.3 89.6 29.9 110.3 21.3 100.5 29.9 100.5 20.4 98.9 16.9 90.3 14.7 83.3 10.8 73.7 26.7 94.9 11.3 86.7 18.1 87.5 8.8 82.8 11.8 83.3 11 83.6 14.9 87 31.9 108.5 17.3…arrow_forward
- After interviewing salespersons at Harley Davidson dealerships, a researcher has created a linear regression line to explain the relationship between a Harley Davidson motorcycle's age (x) and price (y). The regression has an R² = 87.7%. Write a sentence summarizing what R² says about this regression. The age of the motorcycle explains 12.3% of the variation in price. The age of the motorcycle explains 9.36% of the variation in price. The age of the motorcycle explains 87.7% of the variation in price. The price of the motorcycle explains 12.3% of the variation in age. The price of the motorcycle explains 87.7% of the variation in age.arrow_forwardPls help ASAP. Pls show all work.arrow_forwardWhat are the odds in favor of drawing a face card from a standard deck of 52 playing cards? 10:3 13:3 3:13 3:10 auto proctoru.com is sharing your screen Stop sharing Hidearrow_forward
arrow_back_ios
SEE MORE QUESTIONS
arrow_forward_ios
Recommended textbooks for you
- A First Course in Probability (10th Edition)ProbabilityISBN:9780134753119Author:Sheldon RossPublisher:PEARSON

A First Course in Probability (10th Edition)
Probability
ISBN:9780134753119
Author:Sheldon Ross
Publisher:PEARSON