MACROECONOMICS FOR TODAY
10th Edition
ISBN: 9781337613057
Author: Tucker
Publisher: CENGAGE L
expand_more
expand_more
format_list_bulleted
Question
thumb_up100%
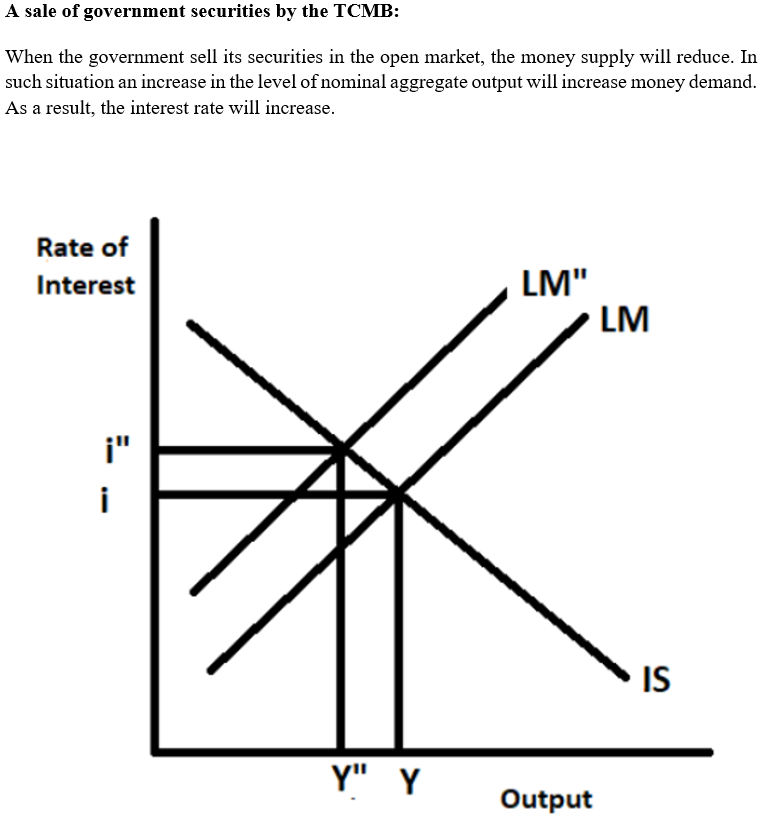
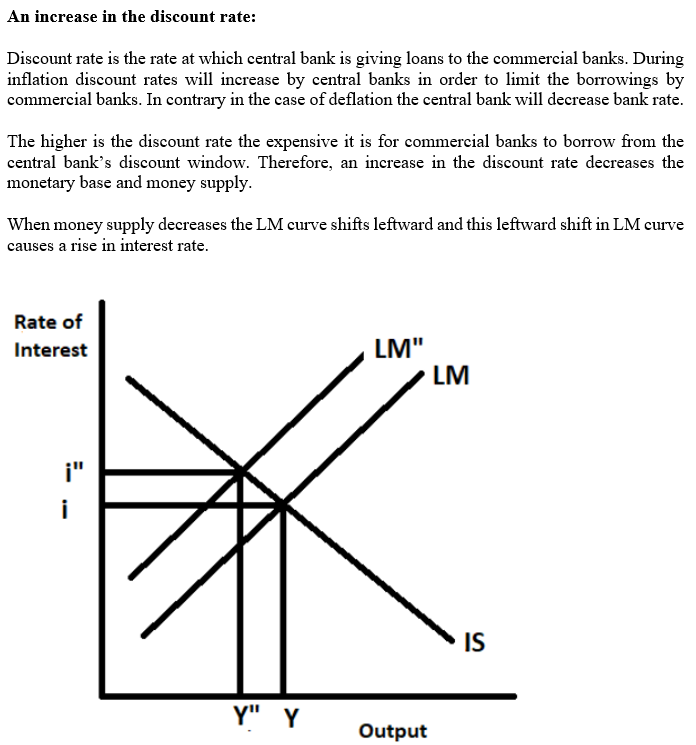
By using graphs, show and explain each of the following events as either leading to an increase or a decrease in the equilibrium interest rate?
d)A sale of government securities by the TCMB
f)An increase in the discount rate
e)decrease in the level of
Expert Solution
arrow_forward
Step 1

arrow_forward
Step 2

Step by stepSolved in 3 steps with 3 images

Knowledge Booster
Learn more about
Need a deep-dive on the concept behind this application? Look no further. Learn more about this topic, economics and related others by exploring similar questions and additional content below.Similar questions
- Problem 1 Suppose the system of aggregate expenditures can be described by the following relationships and parameter values. С (Y — Т) — 1200+ 0.8(Y — Т) I(r) = 100 – 3r G = 200 ; T = 200; r = 5; Ex = Im = 0 1. Suppose in response to the fall in Y, the Federal Reserve pursues a strategy to lower the real interest rate to 2 (note that it was 5 in the original setup to the problem). Identify two specific strategies or monetary policies the fed could employ to accomplish this new interest rate target.arrow_forwardCan you explain me the answer to section a) please?arrow_forwardWhen the housing bubble burst in 2007, home prices fell and this eliminated a large fraction of many households’ home equity. The most likely outcome of this large decrease in the value of households’ assets is: a rightward shift in the aggregate demand curve a rightward shift in the aggregate supply curve a leftward shift in the aggregate demand curve a leftward shift in the aggregate supply curvearrow_forward
- What effects would each of the following have on aggregate demand or aggregate supply? Justify your answer. In each case use a diagram to show the expected effects on the equilibrium price level and real output level in the economy. Assume that all other things remain constant and prices are inflexible downward. (a) A reduction in interest rates at each price level (b) A sizable increase in labor productivity. (c) The nation’s currency appreciates against its major trading partners .arrow_forwardSuppose that the White House decides to sharply reduce military spending without increasing government spending in other areas. a) Comment on the effect of this measure on aggregate demand. b) Show your answer graphically.arrow_forwardSuppose that the production function for the economy is given by: Y = AL/3K/3 Suppose that this economy has 1,000 units of Labour, and 125 units of capital, and TFP (A) is equal to 10. The Short-Run Aggregate Supply Curve (AS) here is given by: Y = 5p And when we consider the AEF at a price level of $1,400, the main components of it (C, I, & G) are given by (we are assuming a closed economy NX = 0): C = 300 + 0.8Y I = 300 G = 200 1. What is potential GDP in this question (Y*)? Show your work. Suppose also that for any $10 decrease in price, desired consumption will increase by $5. 2. Write down the equation for the Aggregate Demand Curve (AD) in the form of Y = a + bp. Show your work. 3. What is the current Short-Run Equilibrium value for Real GDP (Y) and the price level (p)? Show your work. 4. Draw the AD, AS, and LRAS curves. Label all x-intercepts and y-intercepts. Are we currently in an Inflationary Gap, Recessionary Gap, or in Long-Run Equilibrium? How do you know?arrow_forward
- You will draw four separate Aggregate-Demand/Aggregate-Supply graphs. Each graph will have one curve shift. Be sure to label axis, curves, and equilibrium. Change colors to show the shift and label the new equilibrium. Draw an ADAS graph at equilibrium. Suppose the interest rates on loans on capital goods decrease. Which curve will shift? Draw the new equilibrium. Draw an ADAS graph at equilibrium. Suppose there is an decrease in government spending. Which curve will shift? Draw the new equilibrium. Draw an ADAS graph at equilibrium. Suppose the income of our trading partners increase. Which curve will shift? Draw the new equilibrium. Draw an ADAS graph at equilibrium. Suppose there is widespread concern that prices will continue to rise in the future. Which curve will shift? Draw the new equilibrium.arrow_forwardGiven the following circumstances, indicate whether or not the aggregate supply curve would shift and, if so, which way would it shift: The price of a barrel of oil doubles An advance in alternative energy technology significantly reduces its cost In order to maintain a relatively clean air quality, a carbon emissions tax is levied against firms with a carbon footprint As a result of fracking, the price of natural gas is significantly reduced Advances in technology increase the productivity of the American worker, on average, by 30%arrow_forwardThe graph on the right represents initial output in the short run. Suppose real interest rates fall. Using the line drawing tool, draw a new line depicting the new aggregate demand. Label this line 'D₂'. Carefully follow the instructions above and only draw the required object. C Aggregate demand, D Output (real income), Y D=Y D₁arrow_forward
- From the following information, calculate the equilibrium values of Income (Y), interest rate (i) investment (I), net exports (NX), and money demand (md).arrow_forwardConsider a macro-economy that was initially at equilibrium. Using an aggregate demand and aggregate supply diagram model of the economy, graphically illustrate and discuss the short-run and long-run effectsof the following events upon the economy:(a) The imposition of a carbon tax upon local big polluting companies;(b) An appreciation in the foreign exchange rate value of the economy’s currency;(c) A major trading partner’s economy fall into recession;(d) The country’s main exports fall in price while the goods the country imports from abroad rise in pricearrow_forwardSuppose that a consulting firm has generated the following information about the economy of H: (i) the current employment in export industries is 50,000; (ii) the current total employment in the city is 150,000; (iii) export employment is expected to grow by 10,000 jobs. a. Is there enough information to predict the effect of the increase in export employment on total employment? b. If you have enough information, what is the effect? c. If there is insufficient information, proceed with the analysis as far as you can and list the additional information you need to complete the analysis.arrow_forward
arrow_back_ios
SEE MORE QUESTIONS
arrow_forward_ios
Recommended textbooks for you


