
MATLAB: An Introduction with Applications
6th Edition
ISBN: 9781119256830
Author: Amos Gilat
Publisher: John Wiley & Sons Inc
expand_more
expand_more
format_list_bulleted
Related questions
Question
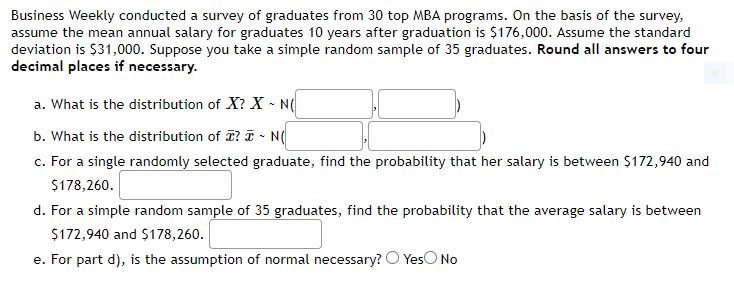

Transcribed Image Text:Business Weekly conducted a survey of graduates from 30 top MBA programs. On the basis of the survey,
assume the mean annual salary for graduates 10 years after graduation is $176,000. Assume the standard
deviation is $31,000. Suppose you take a simple random sample of 35 graduates. Round all answers to four
decimal places if necessary.
a. What is the distribution of X? X - N
b. What is the distribution of I? I - N(
c. For a single randomly selected graduate, find the probability that her salary is between $172,940 and
$178,260.
d. For a simple random sample of 35 graduates, find the probability that the average salary is between
$172,940 and $178,260.
e. For part d), is the assumption of normal necessary? O YesO No
Expert Solution
This question has been solved!
Explore an expertly crafted, step-by-step solution for a thorough understanding of key concepts.

Step by stepSolved in 3 steps

Knowledge Booster

Similar questions
- Motorcycles. The number of motorcyclists killed in motor vehicle traffic crashes in the U.S. in a 7 year span is below. Round your answers to 1 decimal place. 4848 4946 4688 5097 4769 4816 4907 a. Find the mean. deathsb. Find the standard deviation. deathsarrow_forward20. Sampling distribution. From 1975 through 2016, the mean gain of the Down jones industrial average was 470. A random sample of 32 years is selected from population. What is the probability that the mean gain for the sample was between 200 and 500. The standard deviation of population is 1215arrow_forwardplease answer b and earrow_forward
- In a normal distribution, ____ of the distribution lies within one standard deviation of the mean. 50%. 68%. 95%. 99.7%.arrow_forwardScores on an aptitude test are normally distributed with a mean of 960 and standard deviation of 120. Use the Cumulative Z-Score Table to answer the following questions. Write your answer rounded to the nearest whole number. If 1,570,000 students take the test.. how many would you expect to score above 1224? students ...how many would you expect to score above 972? students ...how many would you expect to score between 972 and 1224? studentsarrow_forwardA report announced that the median sales price of new houses sold one year was $231,000, and the mean sales price was $271,000. Assume that the standard deviation of the prices is $100,000. Complete parts (a) through (d) below. (a) If you select samples of n=2, describe the shape of the sampling distribution of X. Choose the correct answer below. A. The sampling distribution will be approximately normal. B. The sampling distribution will depend on the specific sample and will not have a constant shape. C. The sampling distribution is skewed to the right, but less skewed to the right than the population. D. The sampling distribution will be approximately uniform. (b) If you select samples of n=100, describe the shape of the sampling distribution of X. Choose the correct answer below. A. The sampling distribution will depend on the specific sample and will not have a constant shape. B. The sampling…arrow_forward
- The average income in a state was $64 comma 64,000 per person per year. Suppose the standard deviation is $29 comma 29,000 and the distribution is right-skewed. Suppose we take a random sample of 100 residents of the state. Complete parts (a) and (b) below. a. What value should we expect for the sample mean? Why? b. What is the standard error for the sample mean?arrow_forwardWhat is the mean and standard deviation of the sampling distribution of X¯X¯ for n = 16, if the sampled population has a mean of 48 and a standard deviation of 12? Select one: a. 4 and 1 b. 12 and 3 c. 48 and 3 d. 48 and 1 e. 48 and 12arrow_forwardThe average production cost for major movies is 57 million dollars and the standard deviation is 20 million dollars. Assume the production cost distribution is normal. Suppose that 46 randomly selected major movies are researched. Answer the following questions. Give your answers in millions of dollars, not dollars. Round all answers to 4 decimal places where possible. a. What is the distribution of X? X - N( 57 20 b. What is the distribution of ? - N c. For a single randomly selected movie, find the probability that this movie's production cost is between 52 and 55 million dollars. 58 d. For the group of 46 movies, find the probability that the average production cost is between 52 and 55 million dollars. e. For part d), is the assumption of normal necessary? Yes Noarrow_forward
- i need c d and e pleasearrow_forwardSuppose that 49% of all adult women think they do not get enough time for themselves. An opinion poll interviews 958 randomly chosen women and records the sample proportion who feel they don't get enough time for themselves. a. Describe the sampling distribution of p. Mean = ________ Standard Deviation=__________ b. The truth about the population is p=0.49. In what range will the middle 95% of all sample results fall? lower bound -_______________ upper bound -_______________ c. What is the probability that the oll gets a sample in which fewer than 47% say they do not get enough time for themselves.arrow_forwardThe test scores on a science quiz were: 50 50 63 71 74 74 75 77 78 80 85 99. This is a population! ALL QUIZ GRADES! Determine the mean (round to the nearest whole number) and standard deviation (Round to the hundredth place- two decimals). The mean is? and the deviation is ?arrow_forward
arrow_back_ios
arrow_forward_ios
Recommended textbooks for you
- MATLAB: An Introduction with ApplicationsStatisticsISBN:9781119256830Author:Amos GilatPublisher:John Wiley & Sons Inc
 Probability and Statistics for Engineering and th...StatisticsISBN:9781305251809Author:Jay L. DevorePublisher:Cengage Learning
 Statistics for The Behavioral Sciences (MindTap C...StatisticsISBN:9781305504912Author:Frederick J Gravetter, Larry B. WallnauPublisher:Cengage Learning
  Elementary Statistics: Picturing the World (7th E...StatisticsISBN:9780134683416Author:Ron Larson, Betsy FarberPublisher:PEARSON
 The Basic Practice of StatisticsStatisticsISBN:9781319042578Author:David S. Moore, William I. Notz, Michael A. FlignerPublisher:W. H. Freeman
 Introduction to the Practice of StatisticsStatisticsISBN:9781319013387Author:David S. Moore, George P. McCabe, Bruce A. CraigPublisher:W. H. Freeman
MATLAB: An Introduction with Applications
Statistics
ISBN:9781119256830
Author:Amos Gilat
Publisher:John Wiley & Sons Inc
Probability and Statistics for Engineering and th...
Statistics
ISBN:9781305251809
Author:Jay L. Devore
Publisher:Cengage Learning
Statistics for The Behavioral Sciences (MindTap C...
Statistics
ISBN:9781305504912
Author:Frederick J Gravetter, Larry B. Wallnau
Publisher:Cengage Learning
Elementary Statistics: Picturing the World (7th E...
Statistics
ISBN:9780134683416
Author:Ron Larson, Betsy Farber
Publisher:PEARSON
The Basic Practice of Statistics
Statistics
ISBN:9781319042578
Author:David S. Moore, William I. Notz, Michael A. Fligner
Publisher:W. H. Freeman
Introduction to the Practice of Statistics
Statistics
ISBN:9781319013387
Author:David S. Moore, George P. McCabe, Bruce A. Craig
Publisher:W. H. Freeman