
ENGR.ECONOMIC ANALYSIS
14th Edition
ISBN: 9780190931919
Author: NEWNAN
Publisher: Oxford University Press
expand_more
expand_more
format_list_bulleted
Related questions
Question
Help please I'd appreciate it!!!

Transcribed Image Text:Part A.
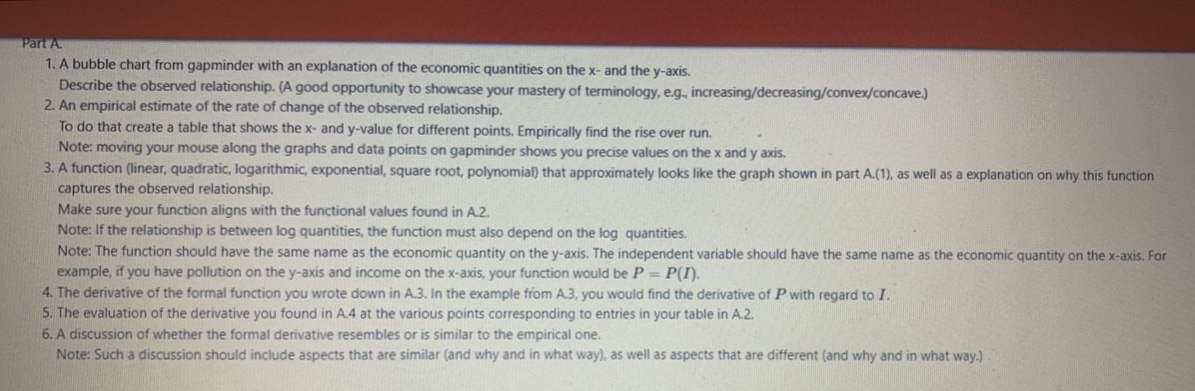
1. A bubble chart from gapminder with an explanation of the economic quantities on the x- and the y-axis.
Describe the observed relationship. (A good opportunity to showcase your mastery of terminology, e.g., increasing/decreasing/convex/concave.)
2. An empirical estimate of the rate of change of the observed relationship.
To do that create a table that shows the x- and y-value for different points. Empirically find the rise over run.
Note: moving your mouse along the graphs and data points on gapminder shows you precise values on the x and y axis.
3. A function (linear, quadratic, logarithmic, exponential, square root, polynomial) that approximately looks like the graph shown in part A.(1), as well as a explanation on why this function
captures the observed relationship.
Make sure your function aligns with the functional values found in A.2.
Note: If the relationship is between log quantities, the function must also depend on the log quantities.
Note: The function should have the same name as the economic quantity on the y-axis. The independent variable should have the same name as the economic quantity on the x-axis. For
example, if you have pollution on the y-axis and income on the x-axis, your function would be P = P(I).
4. The derivative of the formal function you wrote down in A.3. In the example from A.3, you would find the derivative of P with regard to I.
5. The evaluation of the derivative you found in A.4 at the various points corresponding to entries in your table in A.2.
6. A discussion of whether the formal derivative resembles or is similar to the empirical one.
Note: Such a discussion should include aspects that are similar (and why and in what way), as well as aspects that are different (and why and in what way.)
Expert Solution
This question has been solved!
Explore an expertly crafted, step-by-step solution for a thorough understanding of key concepts.

This is a popular solution

Trending nowThis is a popular solution!

Step by stepSolved in 3 steps with 1 images

Knowledge Booster


Learn more about
Need a deep-dive on the concept behind this application? Look no further. Learn more about this topic, economics and related others by exploring similar questions and additional content below.Similar questions
- I cannot read the hand writing can someone tyoe this out for mr please ?arrow_forwarddo it with pencil and paperarrow_forwardImagine you are the mayor of a town and you are trying to decide if you should pay for a fireworks show. Your staff survey your 400 citizens who say that they each value a fireworks show at $10. The fireworks show only costs $3,000 so you put on the show but when you ask for donations to pay for the fireworks you only receive $25 total. What does this result show? Select an answer and submit. For keyboard navigation, use the up/down arrow keys to select an answer. You staff's survey must have overestimated the value of a fireworks show. b The fireworks cost must have been greater than their economic benefit. The firework show suffered from the Tragedy of the Commons problems d The town's citizens were free-riders.arrow_forward
arrow_back_ios
arrow_forward_ios
Recommended textbooks for you
 Principles of Economics (12th Edition)EconomicsISBN:9780134078779Author:Karl E. Case, Ray C. Fair, Sharon E. OsterPublisher:PEARSON
 Engineering Economy (17th Edition)EconomicsISBN:9780134870069Author:William G. Sullivan, Elin M. Wicks, C. Patrick KoellingPublisher:PEARSON
 Principles of Economics (MindTap Course List)EconomicsISBN:9781305585126Author:N. Gregory MankiwPublisher:Cengage Learning
 Managerial Economics: A Problem Solving ApproachEconomicsISBN:9781337106665Author:Luke M. Froeb, Brian T. McCann, Michael R. Ward, Mike ShorPublisher:Cengage Learning
 Managerial Economics & Business Strategy (Mcgraw-...EconomicsISBN:9781259290619Author:Michael Baye, Jeff PrincePublisher:McGraw-Hill Education
Principles of Economics (12th Edition)
Economics
ISBN:9780134078779
Author:Karl E. Case, Ray C. Fair, Sharon E. Oster
Publisher:PEARSON
Engineering Economy (17th Edition)
Economics
ISBN:9780134870069
Author:William G. Sullivan, Elin M. Wicks, C. Patrick Koelling
Publisher:PEARSON
Principles of Economics (MindTap Course List)
Economics
ISBN:9781305585126
Author:N. Gregory Mankiw
Publisher:Cengage Learning
Managerial Economics: A Problem Solving Approach
Economics
ISBN:9781337106665
Author:Luke M. Froeb, Brian T. McCann, Michael R. Ward, Mike Shor
Publisher:Cengage Learning
Managerial Economics & Business Strategy (Mcgraw-...
Economics
ISBN:9781259290619
Author:Michael Baye, Jeff Prince
Publisher:McGraw-Hill Education