
Essentials Of Investments
11th Edition
ISBN: 9781260013924
Author: Bodie, Zvi, Kane, Alex, MARCUS, Alan J.
Publisher: Mcgraw-hill Education,
expand_more
expand_more
format_list_bulleted
Related questions
Question
Tell a story / summary of the Income statement
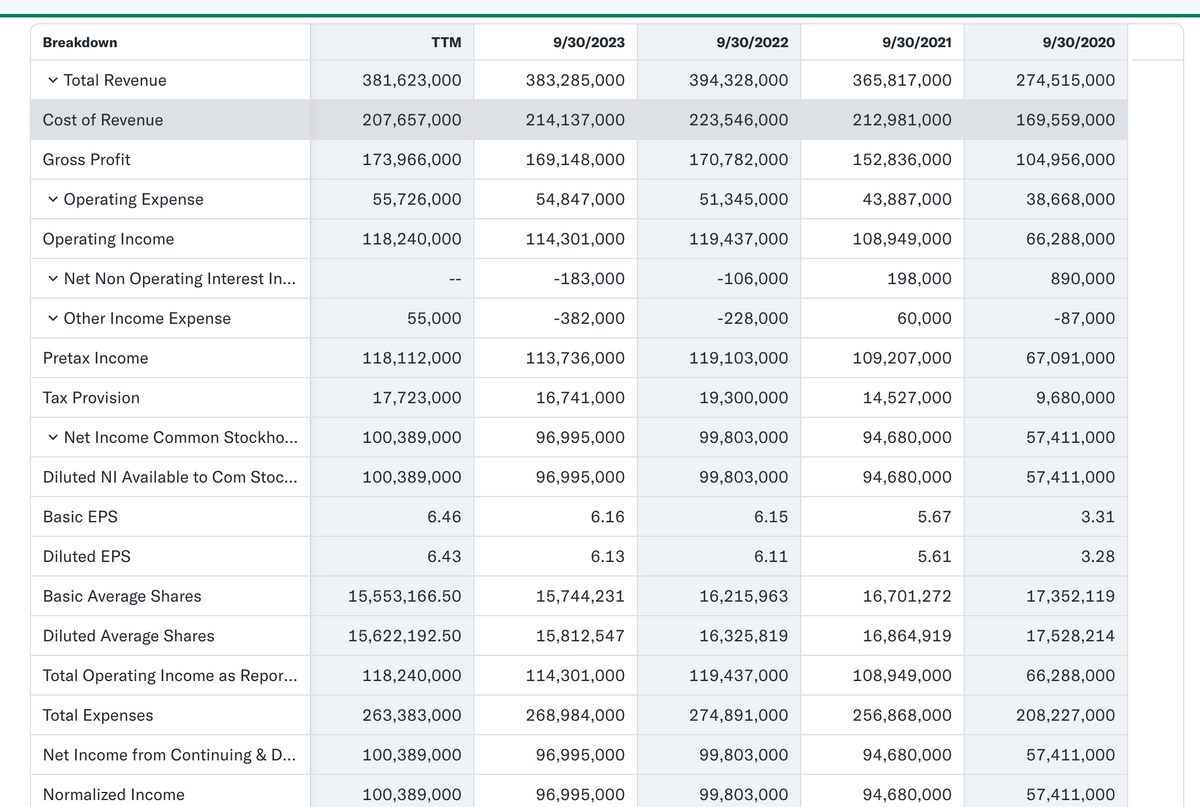

Transcribed Image Text:Breakdown
TTM
9/30/2023
9/30/2022
9/30/2021
9/30/2020
✓ Total Revenue
381,623,000
383,285,000
394,328,000
365,817,000
274,515,000
Cost of Revenue
Gross Profit
✓ Operating Expense
Operating Income
✓ Net Non Operating Interest In...
207,657,000
214,137,000
223,546,000
212,981,000
169,559,000
173,966,000
169,148,000
170,782,000
152,836,000
104,956,000
55,726,000
54,847,000
51,345,000
43,887,000
38,668,000
118,240,000
114,301,000
119,437,000
108,949,000
66,288,000
-183,000
-106,000
198,000
890,000
Other Income Expense
55,000
-382,000
-228,000
60,000
-87,000
Pretax Income
Tax Provision
118,112,000
113,736,000
119,103,000
109,207,000
67,091,000
17,723,000
16,741,000
19,300,000
14,527,000
9,680,000
✓ Net Income Common Stockho...
100,389,000
96,995,000
99,803,000
94,680,000
57,411,000
Diluted NI Available to Com Stoc...
100,389,000
96,995,000
99,803,000
94,680,000
57,411,000
Basic EPS
6.46
6.16
6.15
5.67
3.31
Diluted EPS
6.43
6.13
6.11
5.61
3.28
Basic Average Shares
15,553,166.50
15,744,231
16,215,963
16,701,272
17,352,119
Diluted Average Shares
15,622,192.50
15,812,547
16,325,819
16,864,919
17,528,214
Total Operating Income as Repor...
118,240,000
114,301,000
119,437,000
108,949,000
66,288,000
Total Expenses
263,383,000
268,984,000
274,891,000
256,868,000
208,227,000
Net Income from Continuing & D...
100,389,000
96,995,000
99,803,000
94,680,000
57,411,000
Normalized Income
100,389,000
96,995,000
99,803,000
94,680,000
57,411,000

Transcribed Image Text:Interest Income
Interest Expense
Net Interest Income
EBIT
3,750,000
2,825,000
2,843,000
3,763,000
3,933,000
2,931,000
2,645,000
2,873,000
-183,000
-106,000
198,000
890,000
121,608,000
117,669,000
122,034,000
111,852,000
69,964,000
EBITDA
132,997,000
129,188,000
133,138,000
123,136,000
81,020,000
Reconciled Cost of Revenue
207,657,000
214,137,000
223,546,000
212,981,000
169,559,000
Reconciled Depreciation
11,389,000
11,519,000
11,104,000
11,284,000
11,056,000
Net Income from Continuing Op...
100,389,000
96,995,000
99,803,000
94,680,000
57,411,000
Normalized EBITDA
132,997,000
129,188,000
133,138,000
123,136,000
81,020,000
Tax Rate for Calcs
0
0
0
0
0
Expert Solution
This question has been solved!
Explore an expertly crafted, step-by-step solution for a thorough understanding of key concepts.

Step by stepSolved in 2 steps

Knowledge Booster

Similar questions
- List the components of a statement of comprehensive income statement.arrow_forwardHow to calcuate the taxes on the income statement under operating expense. Please provide an example. Using numbers from an income statement.arrow_forwardWhen using the Spreadsheet (work sheet) method to analyze noncash accounts, it is best to start with Group of answer choices cash net income retained earnings revenuearrow_forward
- when putting together an income statement do the revenues and expenses have to put in order from highter amount to lowest?arrow_forwardMatch the following income and deduction items with their associated forms.arrow_forwardCan I get the income statement, a statement of retained earnings, and a classified balance sheet also?arrow_forward
arrow_back_ios
arrow_forward_ios
Recommended textbooks for you
- Essentials Of InvestmentsFinanceISBN:9781260013924Author:Bodie, Zvi, Kane, Alex, MARCUS, Alan J.Publisher:Mcgraw-hill Education,


 Foundations Of FinanceFinanceISBN:9780134897264Author:KEOWN, Arthur J., Martin, John D., PETTY, J. WilliamPublisher:Pearson,
 Fundamentals of Financial Management (MindTap Cou...FinanceISBN:9781337395250Author:Eugene F. Brigham, Joel F. HoustonPublisher:Cengage Learning
 Corporate Finance (The Mcgraw-hill/Irwin Series i...FinanceISBN:9780077861759Author:Stephen A. Ross Franco Modigliani Professor of Financial Economics Professor, Randolph W Westerfield Robert R. Dockson Deans Chair in Bus. Admin., Jeffrey Jaffe, Bradford D Jordan ProfessorPublisher:McGraw-Hill Education
Essentials Of Investments
Finance
ISBN:9781260013924
Author:Bodie, Zvi, Kane, Alex, MARCUS, Alan J.
Publisher:Mcgraw-hill Education,
Foundations Of Finance
Finance
ISBN:9780134897264
Author:KEOWN, Arthur J., Martin, John D., PETTY, J. William
Publisher:Pearson,
Fundamentals of Financial Management (MindTap Cou...
Finance
ISBN:9781337395250
Author:Eugene F. Brigham, Joel F. Houston
Publisher:Cengage Learning
Corporate Finance (The Mcgraw-hill/Irwin Series i...
Finance
ISBN:9780077861759
Author:Stephen A. Ross Franco Modigliani Professor of Financial Economics Professor, Randolph W Westerfield Robert R. Dockson Deans Chair in Bus. Admin., Jeffrey Jaffe, Bradford D Jordan Professor
Publisher:McGraw-Hill Education