
MATLAB: An Introduction with Applications
6th Edition
ISBN: 9781119256830
Author: Amos Gilat
Publisher: John Wiley & Sons Inc
expand_more
expand_more
format_list_bulleted
Related questions
Concept explainers
Question
I need help with B, C, and D
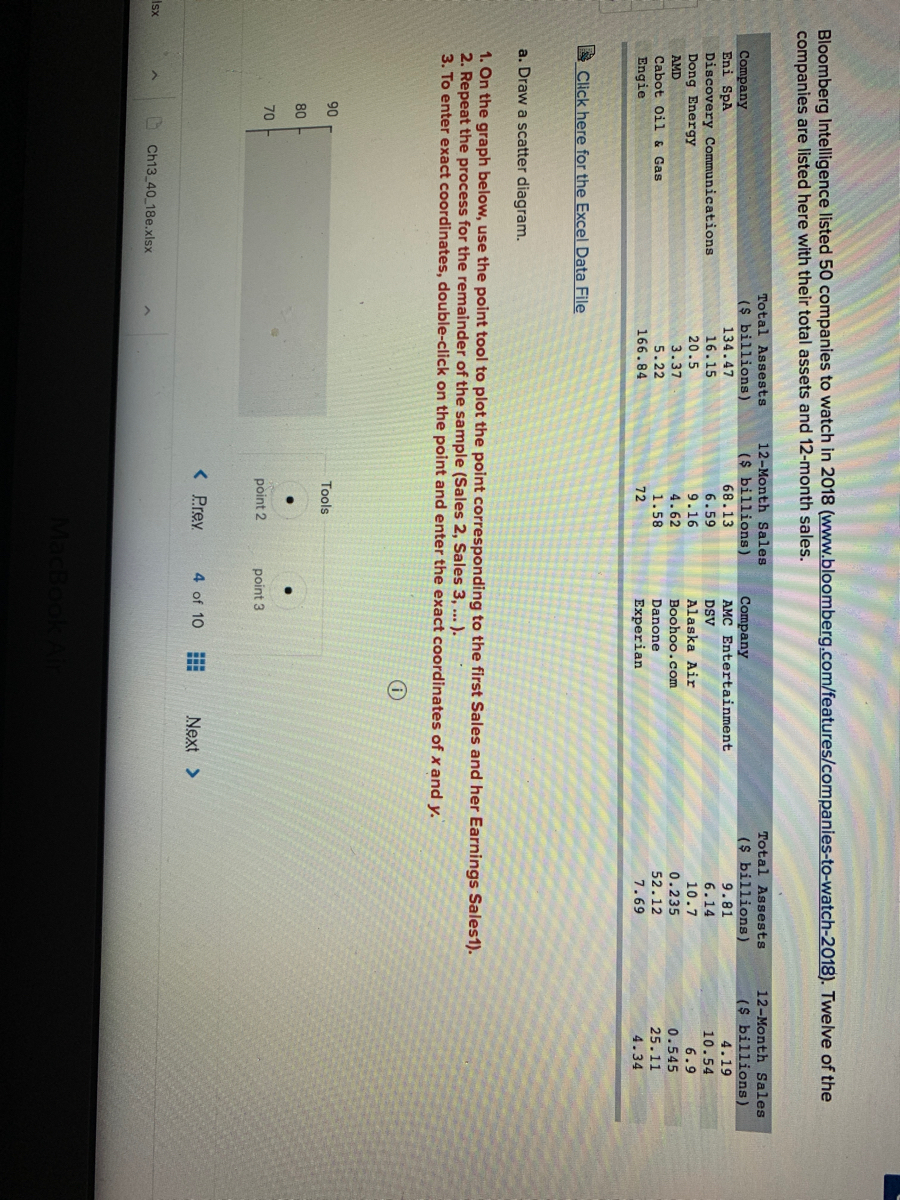

Transcribed Image Text:Bloomberg Intelligence listed 50 companies to watch in 2018 (www.bloomberg.com/features/companies-to-watch-2018). Twelve of the
companies are listed here with their total assets and 12-month sales.
12-Month Sales
Total Assests
Total Assests
($ billions)
134.47
12-Month Sales
($ billions)
4.19
($ billions)
Company
AMC Entertainment
($ billions)
Company
Eni SpA
Discovery Communications
Dong Energy
68.13
9.81
16.15
6.59
9.16
DSV
6.14
10.54
20.5
Alaska Air
10.7
6.9
AMD
3.37
4.62
Boohoo.com
0.235
0.545
5.22
166.84
Cabot Oil & Gas
1.58
Danone
52.12
25.11
Engie
72
Experian
7.69
4.34
I Click here for the Excel Data File
a. Draw a scatter diagram.
1. On the graph below, use the point tool to plot the point corresponding to the first Sales and her Earnings Sales1).
2. Repeat the process for the remainder of the sample (Sales 2, Sales 3, ... ).
3. To enter exact coordinates, double-click on the point and enter the exact coordinates of x and y.
90
Tools
80
70
point 2
point 3
< Prev
4 of 10
Next >
Isx
Ch13_40_18e.xlsx

Transcribed Image Text:Let sales be the dependent variable and total assets the independent variable. (Do not round intermediate calculations. Round your
answers to 4 decimal places.)
b. The coefficient of correlation is
c. The regression equation, with the coefficients, is ŷ =
d. For a company with $100 billion in assets, predict the 12-month sales is
(S billions).
< Prev
4 of 10
Next >
Ch13_40_18e.xlsx
MacBook Air
44
Expert Solution
This question has been solved!
Explore an expertly crafted, step-by-step solution for a thorough understanding of key concepts.

This is a popular solution

Trending nowThis is a popular solution!

Step by stepSolved in 2 steps with 3 images

Knowledge Booster


Learn more about
Need a deep-dive on the concept behind this application? Look no further. Learn more about this topic, statistics and related others by exploring similar questions and additional content below.Similar questions
arrow_back_ios
arrow_forward_ios
Recommended textbooks for you
- MATLAB: An Introduction with ApplicationsStatisticsISBN:9781119256830Author:Amos GilatPublisher:John Wiley & Sons Inc
 Probability and Statistics for Engineering and th...StatisticsISBN:9781305251809Author:Jay L. DevorePublisher:Cengage Learning
 Statistics for The Behavioral Sciences (MindTap C...StatisticsISBN:9781305504912Author:Frederick J Gravetter, Larry B. WallnauPublisher:Cengage Learning
  Elementary Statistics: Picturing the World (7th E...StatisticsISBN:9780134683416Author:Ron Larson, Betsy FarberPublisher:PEARSON
 The Basic Practice of StatisticsStatisticsISBN:9781319042578Author:David S. Moore, William I. Notz, Michael A. FlignerPublisher:W. H. Freeman
 Introduction to the Practice of StatisticsStatisticsISBN:9781319013387Author:David S. Moore, George P. McCabe, Bruce A. CraigPublisher:W. H. Freeman
MATLAB: An Introduction with Applications
Statistics
ISBN:9781119256830
Author:Amos Gilat
Publisher:John Wiley & Sons Inc
Probability and Statistics for Engineering and th...
Statistics
ISBN:9781305251809
Author:Jay L. Devore
Publisher:Cengage Learning
Statistics for The Behavioral Sciences (MindTap C...
Statistics
ISBN:9781305504912
Author:Frederick J Gravetter, Larry B. Wallnau
Publisher:Cengage Learning
Elementary Statistics: Picturing the World (7th E...
Statistics
ISBN:9780134683416
Author:Ron Larson, Betsy Farber
Publisher:PEARSON
The Basic Practice of Statistics
Statistics
ISBN:9781319042578
Author:David S. Moore, William I. Notz, Michael A. Fligner
Publisher:W. H. Freeman
Introduction to the Practice of Statistics
Statistics
ISBN:9781319013387
Author:David S. Moore, George P. McCabe, Bruce A. Craig
Publisher:W. H. Freeman