MATLAB: An Introduction with Applications
6th Edition
ISBN: 9781119256830
Author: Amos Gilat
Publisher: John Wiley & Sons Inc
expand_more
expand_more
format_list_bulleted
Question

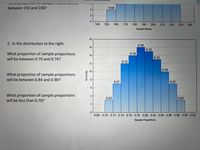
Transcribed Image Text:between 150 and 230?
0.04
4
140
150
160
170
180
190
200
210
220
230
240
Sample Means
18
2. In the distribution to the right:
0.16
16
0.15
What proportion of sample proportions
0.14
14
0.13
will be between 0.70 and 0.74?
0.12
12
0.10
10
What proportion of sample proportions
will be between 0.84 and 0.90?
0.07
0.07
What proportion of sample proportions
4
0.03
0.03
will be less than 0.70?
0.68 0.70 0.72 0.74 0.76 0.78 0.80 0.82 0.84 0.86 0.88 0.90 0.92
Sample Proportions
No of obs
Expert Solution
This question has been solved!
Explore an expertly crafted, step-by-step solution for a thorough understanding of key concepts.
This is a popular solution
Trending nowThis is a popular solution!
Step by stepSolved in 2 steps with 1 images

Knowledge Booster
Similar questions
- What is the standard deviation of the following sample data: 40, 49, 23, 47, 40, 17. Round to 2 decimal places as needed.arrow_forward1. In a sentence or two, explain what a sampling distribution is. 2. In a sentence or two explain how the standard error of the mean is similar to the standard deviation.arrow_forward1. Comment on the shape of the distribution. 2. Use the empirical rule to state the percentage of annual sales between 1255 and 9181(millions of dollars) 3. Based on the z score, is the highest sale, $14138 (in millions) an outlier? Explainarrow_forward
- What is the proportion that lies between the z scores under the normal curve? A. 1.00 and -1.00 B. 1.96 and -1.96 C. 2.58 and -2.58 D. 0.00 and 1.00 E. 1.50 and 0.10 F. 2.00 and 0.80arrow_forwardHere is a sample data set. Frequency 153.1 201.4 209.3 221.3 225.4 228.8 232.8 278.7 282.5 282.6 283.4 290.6 342.9 342.9 342.9 345.2 349.2 358.4 362.8 370.5 379.8 387.9 390.7 403.9 404.3 427.9 434.9 434.9 441.2 443 445 449.4 450.6 460.4 468.5 469.4 480.6 482 489.6 515.6 484.8 488.9 488.9 488.9 525.7 526.5 537.1 537.9 614.3 685.1 739.2 751.7 557.6 599.9 10 8 6 4 2 15000500050005608500050005000 length (cm) Find the first quartile for this data set. Q₁ = Find the third quartile for this data set. Q3= = Find the interquartile range for this data set. IQR = Find the lower fence separating outliers from usual values. Fence low = Find the upper fence separating outliers from usual values. Fence higharrow_forwardSuppose the true population proportion is p = 0.5. The figure below shows the distribution of the sample proportion (p) values for 3 different sample sizes, n = 20, n=100 and n=500. 0.2 0.4 0.6 0.8 0.2 0.4 0.6 0.8 0.2 0.4 0.6 0.8arrow_forward
- 3. Calculate the mean and median for the data representing the number of hours a random person spends online. Explain what this tells you about the shape of your distribution and which measure for the spread would be best? 15 12 6.2 7 5.5 2 4 5 10 11 7 6 4 7 01 5 3.2 4 10 6 2 10 1.5 5.1 6.4 8 14 3 2 4. Based on the distribution that you found in part 3, indicate whether the data is symmetric or skewed and then calculate the best measure for the spread of the distribution: Standard deviation or IQR. What information does this measure provide in terms of your data?arrow_forward9. If we take samples of size 110 from a population with proportion 0.39, comment on whether the sampling distribution follows a normal distribution. Explain.arrow_forward
arrow_back_ios
arrow_forward_ios
Recommended textbooks for you
 MATLAB: An Introduction with ApplicationsStatisticsISBN:9781119256830Author:Amos GilatPublisher:John Wiley & Sons Inc
 Probability and Statistics for Engineering and th...StatisticsISBN:9781305251809Author:Jay L. DevorePublisher:Cengage Learning
 Statistics for The Behavioral Sciences (MindTap C...StatisticsISBN:9781305504912Author:Frederick J Gravetter, Larry B. WallnauPublisher:Cengage Learning
 Elementary Statistics: Picturing the World (7th E...StatisticsISBN:9780134683416Author:Ron Larson, Betsy FarberPublisher:PEARSON
 The Basic Practice of StatisticsStatisticsISBN:9781319042578Author:David S. Moore, William I. Notz, Michael A. FlignerPublisher:W. H. Freeman
 Introduction to the Practice of StatisticsStatisticsISBN:9781319013387Author:David S. Moore, George P. McCabe, Bruce A. CraigPublisher:W. H. Freeman

MATLAB: An Introduction with Applications
Statistics
ISBN:9781119256830
Author:Amos Gilat
Publisher:John Wiley & Sons Inc

Probability and Statistics for Engineering and th...
Statistics
ISBN:9781305251809
Author:Jay L. Devore
Publisher:Cengage Learning

Statistics for The Behavioral Sciences (MindTap C...
Statistics
ISBN:9781305504912
Author:Frederick J Gravetter, Larry B. Wallnau
Publisher:Cengage Learning

Elementary Statistics: Picturing the World (7th E...
Statistics
ISBN:9780134683416
Author:Ron Larson, Betsy Farber
Publisher:PEARSON

The Basic Practice of Statistics
Statistics
ISBN:9781319042578
Author:David S. Moore, William I. Notz, Michael A. Fligner
Publisher:W. H. Freeman

Introduction to the Practice of Statistics
Statistics
ISBN:9781319013387
Author:David S. Moore, George P. McCabe, Bruce A. Craig
Publisher:W. H. Freeman