MATLAB: An Introduction with Applications
6th Edition
ISBN: 9781119256830
Author: Amos Gilat
Publisher: John Wiley & Sons Inc
expand_more
expand_more
format_list_bulleted
Question

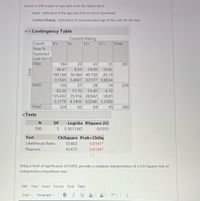
Transcribed Image Text:Below is JMP output of app data from the Apple Store.
Cost - Indication if the app was free or not to download
Content Rating Indication of recommended age of the user for the app
Contingency Table
Content Rating
12+
Count
4+
9+
17+
Total
Row %
Expected
Cell Chi^2
FREE
194
25
41
31
291
66.67
8.59
14.09
10.65
188.568 36.084 40.158
0.1565 3.4047 0.0177 0.8834
26.19
PAID
130
37
28
14
209
62.20
17.70
13.40
6.70
135.432 25.916 28.842
0.2179 4.7405 0.0246 1.2300
69
18.81
Total
324
62
45
500
Tests
DF
-LogLike RSquare (U)
500
3
5.3011347
0.0103
Test
ChiSquare Prob>ChiSq
Likelihood Ratio
10.602
0.0141*
Pearson
10.675
0.0136*
Using a level of significance of 0.005, provide a complete interpretation of a Chi-Square test of
independence hypothesis test.
Edit
View Insert Format Tools
Table
12pt v
Paragraph
B IU
A v
Cost
Expert Solution
This question has been solved!
Explore an expertly crafted, step-by-step solution for a thorough understanding of key concepts.
This is a popular solution
Trending nowThis is a popular solution!
Step by stepSolved in 2 steps

Knowledge Booster
Similar questions
- Provide a reason why the classification of data is important.arrow_forwardAplicaciones M Gmail YouTube Maps Noticias G Traducir T&content_id%3D * Question Completion Status: The following set of data represents the number of orders filled by a national-chain restaurant during a two week period. Construct a five number summary for the the data. 66, 75, 68, 89, 86, 73, 67, 75, 75, 82, 85, 74, 67, 61 (Round to the nearest hundredth, if needed). Min Lower Quartile Median Upper Quartile Maximum What is the range and the interquartile range (IQR)? Range Interquartile Range (1QR) local, family-owned restaurant also gathered data for two weeks of orders. The following set of data represents the number of orders filled by this Save All Ans Click Save and Submit to save and submit. Click Save All Answers to save all answers. Relative Reading - Mapp.pdf ANY Worksheet - Py....docx W Worksheet - W....docx * MLK Letter -2.pdf ACIC 四国07A| útv DIC. 11arrow_forwardList an advatge of microdata, and of aggregated data Answer in a few sentences thank you.arrow_forward
- The results of a common standardized test used in psychology research is designed so that the population mean is 105 and the standard devlation is 30. A subject earns a score of 108. What is the Z-score for this raw score? Z-Score =arrow_forwardCreate an example of 2 data sets with the same range and the same number of values that have different standard deviationsarrow_forwarddoes the interquartile range of a data set affect the way the data is graphed?arrow_forward
- Please anwser using SPSS!arrow_forwardThe average income in the state of California is a population parameter. True or False?arrow_forwardUse the given minimum and maximum data entries, and the number of classes, to find the class width, the lower class limits, and the upper class limits. minimum=9, maximum=53, 7 classes. What is the class width?arrow_forward
arrow_back_ios
arrow_forward_ios
Recommended textbooks for you
 MATLAB: An Introduction with ApplicationsStatisticsISBN:9781119256830Author:Amos GilatPublisher:John Wiley & Sons Inc
 Probability and Statistics for Engineering and th...StatisticsISBN:9781305251809Author:Jay L. DevorePublisher:Cengage Learning
 Statistics for The Behavioral Sciences (MindTap C...StatisticsISBN:9781305504912Author:Frederick J Gravetter, Larry B. WallnauPublisher:Cengage Learning
 Elementary Statistics: Picturing the World (7th E...StatisticsISBN:9780134683416Author:Ron Larson, Betsy FarberPublisher:PEARSON
 The Basic Practice of StatisticsStatisticsISBN:9781319042578Author:David S. Moore, William I. Notz, Michael A. FlignerPublisher:W. H. Freeman
 Introduction to the Practice of StatisticsStatisticsISBN:9781319013387Author:David S. Moore, George P. McCabe, Bruce A. CraigPublisher:W. H. Freeman

MATLAB: An Introduction with Applications
Statistics
ISBN:9781119256830
Author:Amos Gilat
Publisher:John Wiley & Sons Inc

Probability and Statistics for Engineering and th...
Statistics
ISBN:9781305251809
Author:Jay L. Devore
Publisher:Cengage Learning

Statistics for The Behavioral Sciences (MindTap C...
Statistics
ISBN:9781305504912
Author:Frederick J Gravetter, Larry B. Wallnau
Publisher:Cengage Learning

Elementary Statistics: Picturing the World (7th E...
Statistics
ISBN:9780134683416
Author:Ron Larson, Betsy Farber
Publisher:PEARSON

The Basic Practice of Statistics
Statistics
ISBN:9781319042578
Author:David S. Moore, William I. Notz, Michael A. Fligner
Publisher:W. H. Freeman

Introduction to the Practice of Statistics
Statistics
ISBN:9781319013387
Author:David S. Moore, George P. McCabe, Bruce A. Craig
Publisher:W. H. Freeman