
MATLAB: An Introduction with Applications
6th Edition
ISBN: 9781119256830
Author: Amos Gilat
Publisher: John Wiley & Sons Inc
expand_more
expand_more
format_list_bulleted
Related questions
Concept explainers
Topic Video
Question

Transcribed Image Text:A psu.instructure.com
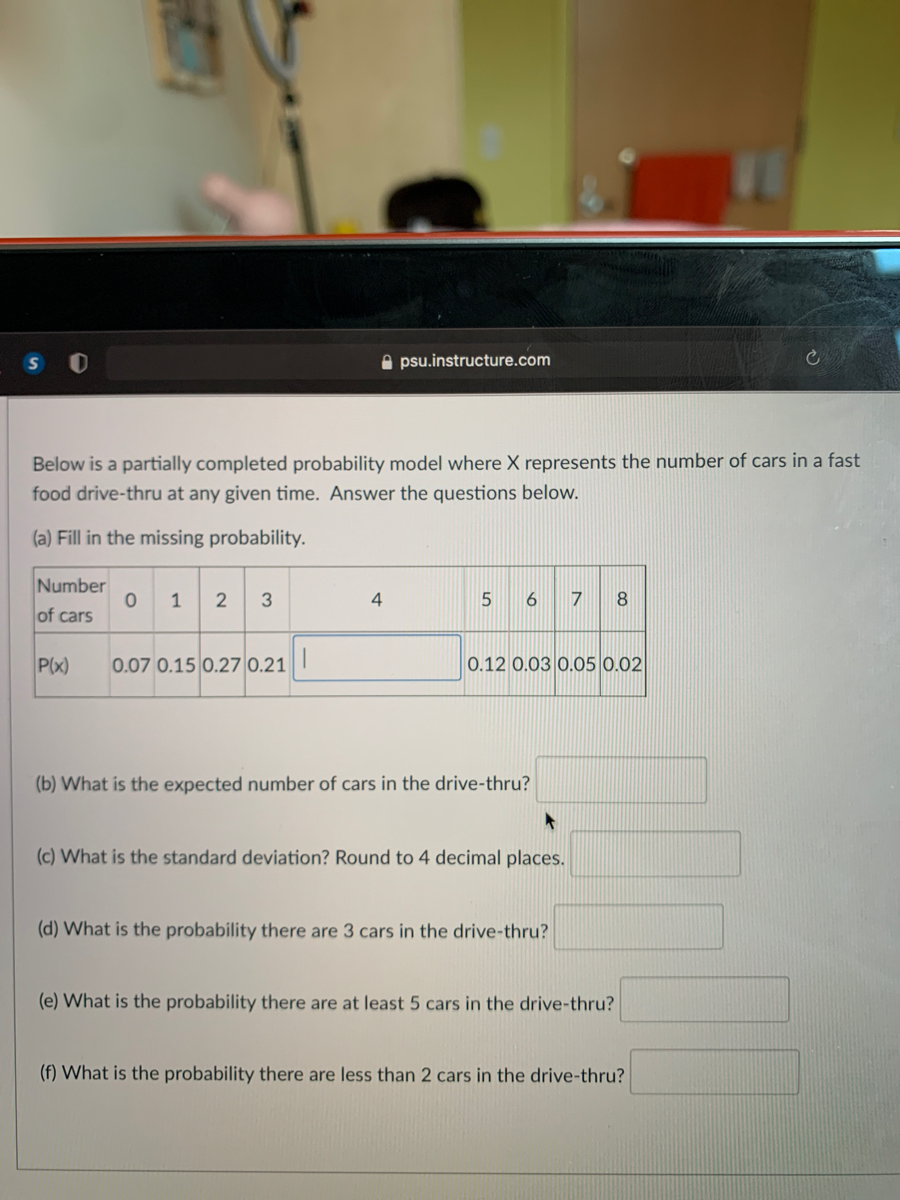
Below is a partially completed probability mod
food drive-thru at any given time. Answer the questions below.
where X represents the number of cars in a fast
(a) Fill in the missing probability.
Number
0 1 2 3
4
8.
of cars
P(x)
0.07 0.15 0.27 0.21
0.12 0.03 0.05 0.02
(b) What is the expected number of cars in the drive-thru?
(c) What is the standard deviation? Round to 4 decimal places.
(d) What is the probability there are 3 cars in the drive-thru?
(e) What is the probability there are at least 5 cars in the drive-thru?
(f) What is the probability there are less than 2 cars in the drive-thru?
6
Expert Solution
This question has been solved!
Explore an expertly crafted, step-by-step solution for a thorough understanding of key concepts.

This is a popular solution

Trending nowThis is a popular solution!

Step by stepSolved in 4 steps with 5 images

Follow-up Questions
Read through expert solutions to related follow-up questions below.
Follow-up Question
What is the
Solution
by Bartleby Expert
Follow-up Questions
Read through expert solutions to related follow-up questions below.
Follow-up Question
What is the
Solution
by Bartleby Expert
Knowledge Booster


Learn more about
Need a deep-dive on the concept behind this application? Look no further. Learn more about this topic, statistics and related others by exploring similar questions and additional content below.Similar questions
- Here is the probability model for the blood type of a randomly chosen person in the United States. Blood type O A B AB Probability 0.53 0.22 0.06 0.19 What is the probability that a randomly chosen American does not have type O blood? ______________% Round to the nearest 0.01%arrow_forwardA used-car dealer gets complaints about his cars as shown in the table. Number of complaints per day Probability 0 1 2 0.01 0.04 0.2 4 5 6 0.3 0.11 0.09 Find the expected number of complaints per day. The expected number of complaints per day is (Do not round your answer.) 3 0.25arrow_forwardSeveral friends chartered a boat for a day's fishing. They caught a total of 63 fish. The table below provides information about the type and number of fish caught. Determine the empirical probability that the next fish caught is a kingfish. Fish Number caught Grouper Shark Flounder Kingfish 11 20 6 26 P(kingfish) = (Simplify your answer. Type a fraction.)arrow_forward
- A(n) ________ relates each possible outcome to its probability of occurrence. A. frequency B. probability distribution C. coin toss D. expected valuearrow_forwardCan you please help me understand the process of solving this question?arrow_forwardBelow is a partially complete probability model. Enter the probability for the final outcome. Outcome 3 3 3.5 6 Probability 0.35 0.2 0.15 Find the expected value of the probability model. Speakarrow_forward
- Calculate the probability of 3 or 4 based on the following probability distribution. 1 4 p(x) 0.2 0.1 0.3 0.8 O0.6 O 0.7 erarrow_forward2. The probability model of the number of dinners that a typical American cook in a week is as follows. Number of dinners: 1 3 4 6. 7. Probability: 0.05 0.05 0.1 0.15 0.15 0.2 ? 0.2 Complete the probability table (find the missing probability)arrow_forwardDetermine whether the following are valid probability models or not. Type "VALID" if it is valid, or type "INVALID" if it is not.arrow_forward
- A used-car dealer gets complaints about his cars as shown in the table. Number of complaints per day 0 1 2 Probability 3 4 5 6 0.02 0.06 0.17 0.25 0.3 0.11 0.09 Find the expected number of complaints per day. The expected number of complaints per day is (Do not round your answer.)arrow_forwardPlease don't hand writing suliutioarrow_forward
arrow_back_ios
arrow_forward_ios
Recommended textbooks for you
- MATLAB: An Introduction with ApplicationsStatisticsISBN:9781119256830Author:Amos GilatPublisher:John Wiley & Sons Inc
 Probability and Statistics for Engineering and th...StatisticsISBN:9781305251809Author:Jay L. DevorePublisher:Cengage Learning
 Statistics for The Behavioral Sciences (MindTap C...StatisticsISBN:9781305504912Author:Frederick J Gravetter, Larry B. WallnauPublisher:Cengage Learning
  Elementary Statistics: Picturing the World (7th E...StatisticsISBN:9780134683416Author:Ron Larson, Betsy FarberPublisher:PEARSON
 The Basic Practice of StatisticsStatisticsISBN:9781319042578Author:David S. Moore, William I. Notz, Michael A. FlignerPublisher:W. H. Freeman
 Introduction to the Practice of StatisticsStatisticsISBN:9781319013387Author:David S. Moore, George P. McCabe, Bruce A. CraigPublisher:W. H. Freeman
MATLAB: An Introduction with Applications
Statistics
ISBN:9781119256830
Author:Amos Gilat
Publisher:John Wiley & Sons Inc
Probability and Statistics for Engineering and th...
Statistics
ISBN:9781305251809
Author:Jay L. Devore
Publisher:Cengage Learning
Statistics for The Behavioral Sciences (MindTap C...
Statistics
ISBN:9781305504912
Author:Frederick J Gravetter, Larry B. Wallnau
Publisher:Cengage Learning
Elementary Statistics: Picturing the World (7th E...
Statistics
ISBN:9780134683416
Author:Ron Larson, Betsy Farber
Publisher:PEARSON
The Basic Practice of Statistics
Statistics
ISBN:9781319042578
Author:David S. Moore, William I. Notz, Michael A. Fligner
Publisher:W. H. Freeman
Introduction to the Practice of Statistics
Statistics
ISBN:9781319013387
Author:David S. Moore, George P. McCabe, Bruce A. Craig
Publisher:W. H. Freeman