MATLAB: An Introduction with Applications
6th Edition
ISBN: 9781119256830
Author: Amos Gilat
Publisher: John Wiley & Sons Inc
expand_more
expand_more
format_list_bulleted
Question

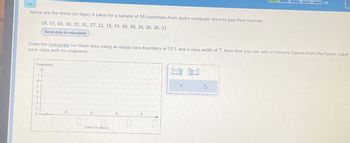
Transcribed Image Text:Below are the times (in days) it takes for a sample of 16 customers from Jack's computer store to pay their invoices.
19, 15, 43, 39, 35, 31, 27, 22, 18, 14, 30, 30, 26, 26, 26, 21
Send data to calculator
Draw the histogram for these data using an initial class boundary of 13.5 and a class width of 7. Note that you can add or remove classes from the figure. Label
each class with its endpoints.
Frequency
7
6
5
4
3.
2.
1-
0
0
0
Time (in days)
0
0:00 00:0
X
$
Expert Solution
This question has been solved!
Explore an expertly crafted, step-by-step solution for a thorough understanding of key concepts.
This is a popular solution
Trending nowThis is a popular solution!
Step by stepSolved in 3 steps with 3 images

Knowledge Booster
Similar questions
- Use the given minimum and maximum data entries, and the number of classes, to find the class width, the lower class limits, and the upper class limits. minimum = 9, maximum = 83, 6 classes The class width is 12. Choose the correct lower class limits below. O A. 9, 21, 35, 47, 60, 74 O B. 22, 34, 48, 61, 74, 86 O C. 21, 34, 48, 60, 73, 86 O D. 9, 22, 35, 48, 61, 74 Choose the correct upper class limits below. A. 21, 34, 48, 61, 73, 86 O B. 22, 35, 48, 61, 74, 86 O C. 22, 35, 47, 60, 74, 86 O D. 21, 34, 47, 60, 73, 86arrow_forwardFor the data set: 5, 11, 1, 2, 27, 30, 15 we would have the middle number being 2. Why isn’t 2 the median here – what did we forget to do or what is missing?arrow_forwardplease help.arrow_forward
- Please only do B, C, and D...arrow_forwardUse the given minimum and maximum data entries, and the number of classes, to find the class width, the lower class limits, and the upper class limits. minimum = 7, maximum = 70, 6 classes. The class width is Choose the correct lower class limits below. OA. 18, 28, 40, 51, 62, 72 OB. 7, 18, 29, 40, 51, 62 OC. 7, 17, 29, 39, 50, 62 OD. 17, 28, 40, 50, 61, 72 Choose the correct upper class limits below. OA. 18, 29, 39, 50, 62, 72 OB. 18, 29, 40, 51, 62, 72 C. 17, 28, 40, 51, 61, 72 OD. 17, 28, 39, 50, 61, 72arrow_forwardGiven the following set of data, determine the mode.arrow_forward
- A statistics professor kept attendance records and recorded the number of absent students per class. This data is displayed in the following histogram with the frequency of each number of absent students shown above the bars. How many total classes do these data represent?arrow_forwardA small organic chemistry class just took their midterm. The scores of the eight students are listed below. 65, 73, 78, 85, 87, 69, 90, 32 What type of graph could you use to represent this data? A. histogram B. bar chart C. pie chart D. stem and leaf E. All of the above O F. A and D only G. B and C only Click to select your answer. O Oarrow_forwardPaleontology students went on a dig for fossils. The following data set contains the number of fossils found by a sample of 12 students. 9,12,8,49,15,12,21,17,19,13,18,119,12,8,49,15,12,21,17,19,13,18,11 Click to download the data in your preferred format. CrunchIt! CSV Excel JMP Mac Text Minitab PC Text R SPSS TI Calc What is the median number of fossils found by the students? median: fossilsarrow_forward
- Answer 3 and 4 onlyarrow_forwardGiven the set of 3 data points 82, ____, _____ Find the 2 missing terms if the median is 84. Once you find one answer, explain how you found your answer and if it is possible to have more than one answer. Please give details about the other possible data pointsarrow_forwardConsider the following data. 14,6,−11,−6,5,1014,6,−11,−6,5,10 Copy Data Step 1 of 3: Determine the mean of the given data.arrow_forward
arrow_back_ios
SEE MORE QUESTIONS
arrow_forward_ios
Recommended textbooks for you
 MATLAB: An Introduction with ApplicationsStatisticsISBN:9781119256830Author:Amos GilatPublisher:John Wiley & Sons Inc
 Probability and Statistics for Engineering and th...StatisticsISBN:9781305251809Author:Jay L. DevorePublisher:Cengage Learning
 Statistics for The Behavioral Sciences (MindTap C...StatisticsISBN:9781305504912Author:Frederick J Gravetter, Larry B. WallnauPublisher:Cengage Learning
 Elementary Statistics: Picturing the World (7th E...StatisticsISBN:9780134683416Author:Ron Larson, Betsy FarberPublisher:PEARSON
 The Basic Practice of StatisticsStatisticsISBN:9781319042578Author:David S. Moore, William I. Notz, Michael A. FlignerPublisher:W. H. Freeman
 Introduction to the Practice of StatisticsStatisticsISBN:9781319013387Author:David S. Moore, George P. McCabe, Bruce A. CraigPublisher:W. H. Freeman

MATLAB: An Introduction with Applications
Statistics
ISBN:9781119256830
Author:Amos Gilat
Publisher:John Wiley & Sons Inc

Probability and Statistics for Engineering and th...
Statistics
ISBN:9781305251809
Author:Jay L. Devore
Publisher:Cengage Learning

Statistics for The Behavioral Sciences (MindTap C...
Statistics
ISBN:9781305504912
Author:Frederick J Gravetter, Larry B. Wallnau
Publisher:Cengage Learning

Elementary Statistics: Picturing the World (7th E...
Statistics
ISBN:9780134683416
Author:Ron Larson, Betsy Farber
Publisher:PEARSON

The Basic Practice of Statistics
Statistics
ISBN:9781319042578
Author:David S. Moore, William I. Notz, Michael A. Fligner
Publisher:W. H. Freeman

Introduction to the Practice of Statistics
Statistics
ISBN:9781319013387
Author:David S. Moore, George P. McCabe, Bruce A. Craig
Publisher:W. H. Freeman