
MATLAB: An Introduction with Applications
6th Edition
ISBN: 9781119256830
Author: Amos Gilat
Publisher: John Wiley & Sons Inc
expand_more
expand_more
format_list_bulleted
Related questions
Question
Please label each part
SUBPART
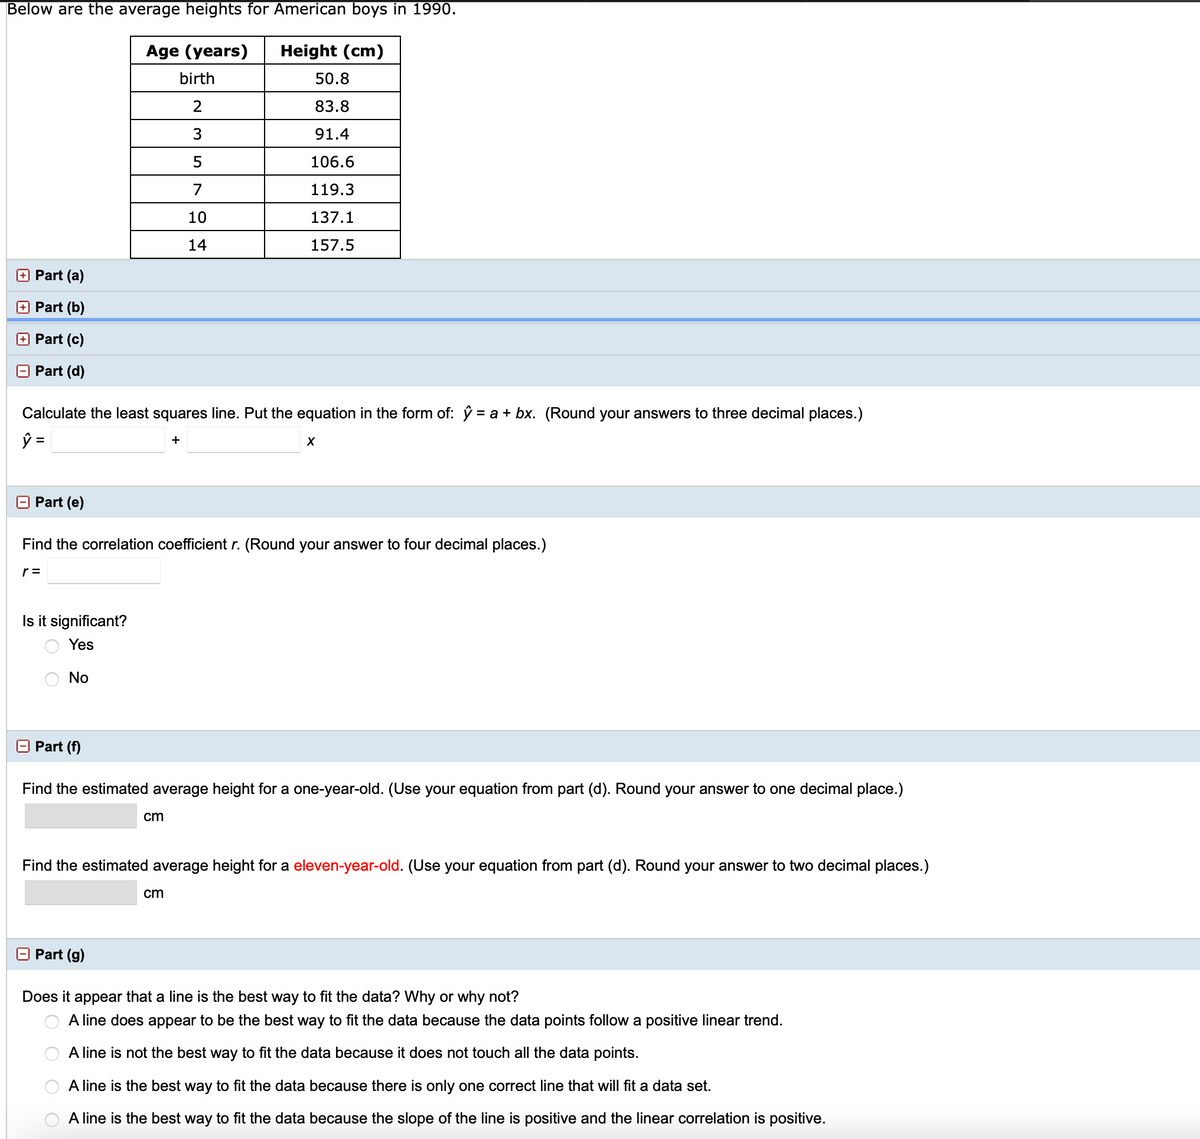

Transcribed Image Text:Below are the average heights for American boys in 1990.
Age (years)
Height (cm)
birth
50.8
2
83.8
3
91.4
5
106.6
7
119.3
10
137.1
14
157.5
+ Part (a)
+ Part (b)
+ Part (c)
Part (d)
Calculate the least squares line. Put the equation in the form of: ý = a + bx. (Round your answers to three decimal places.)
%3D
Part (e)
Find the correlation coefficient r. (Round your answer to four decimal places.)
r =
Is it significant?
Yes
No
O Part (f)
Find the estimated average height for a one-year-old. (Use your equation from part (d). Round your answer to one decimal place.)
cm
Find the estimated average height for a eleven-year-old. (Use your equation from part (d). Round your answer to two decimal places.)
cm
O Part (g)
Does it appear that a line is the best way to fit the data? Why or why not?
A line does appear to be the best way to fit the data because the data points follow a positive linear trend.
A line is not the best way to fit the data because it does not touch all the data points.
A line is the best way to fit the data because there is only one correct line that will fit a data set.
A line is the best way to fit the data because the slope of the line is positive and the linear correlation is positive.
O O O O
Expert Solution
This question has been solved!
Explore an expertly crafted, step-by-step solution for a thorough understanding of key concepts.

This is a popular solution

Trending nowThis is a popular solution!

Step by stepSolved in 4 steps with 1 images

Knowledge Booster


Learn more about
Need a deep-dive on the concept behind this application? Look no further. Learn more about this topic, statistics and related others by exploring similar questions and additional content below.Similar questions
arrow_back_ios
arrow_forward_ios
Recommended textbooks for you
- MATLAB: An Introduction with ApplicationsStatisticsISBN:9781119256830Author:Amos GilatPublisher:John Wiley & Sons Inc
 Probability and Statistics for Engineering and th...StatisticsISBN:9781305251809Author:Jay L. DevorePublisher:Cengage Learning
 Statistics for The Behavioral Sciences (MindTap C...StatisticsISBN:9781305504912Author:Frederick J Gravetter, Larry B. WallnauPublisher:Cengage Learning
  Elementary Statistics: Picturing the World (7th E...StatisticsISBN:9780134683416Author:Ron Larson, Betsy FarberPublisher:PEARSON
 The Basic Practice of StatisticsStatisticsISBN:9781319042578Author:David S. Moore, William I. Notz, Michael A. FlignerPublisher:W. H. Freeman
 Introduction to the Practice of StatisticsStatisticsISBN:9781319013387Author:David S. Moore, George P. McCabe, Bruce A. CraigPublisher:W. H. Freeman
MATLAB: An Introduction with Applications
Statistics
ISBN:9781119256830
Author:Amos Gilat
Publisher:John Wiley & Sons Inc
Probability and Statistics for Engineering and th...
Statistics
ISBN:9781305251809
Author:Jay L. Devore
Publisher:Cengage Learning
Statistics for The Behavioral Sciences (MindTap C...
Statistics
ISBN:9781305504912
Author:Frederick J Gravetter, Larry B. Wallnau
Publisher:Cengage Learning
Elementary Statistics: Picturing the World (7th E...
Statistics
ISBN:9780134683416
Author:Ron Larson, Betsy Farber
Publisher:PEARSON
The Basic Practice of Statistics
Statistics
ISBN:9781319042578
Author:David S. Moore, William I. Notz, Michael A. Fligner
Publisher:W. H. Freeman
Introduction to the Practice of Statistics
Statistics
ISBN:9781319013387
Author:David S. Moore, George P. McCabe, Bruce A. Craig
Publisher:W. H. Freeman