
MATLAB: An Introduction with Applications
6th Edition
ISBN: 9781119256830
Author: Amos Gilat
Publisher: John Wiley & Sons Inc
expand_more
expand_more
format_list_bulleted
Related questions
Question

Transcribed Image Text:(2W RW gl|SC| ( | M Si
|
JI W
Er
cation.com/ext/map/index.html?_con=con&external_browser=0&launch
itags | Tag Ge...... What is 90 percent... Netflix
Netflix
Instagram
Chapter 4 (Sections 4.1 through 4.5)
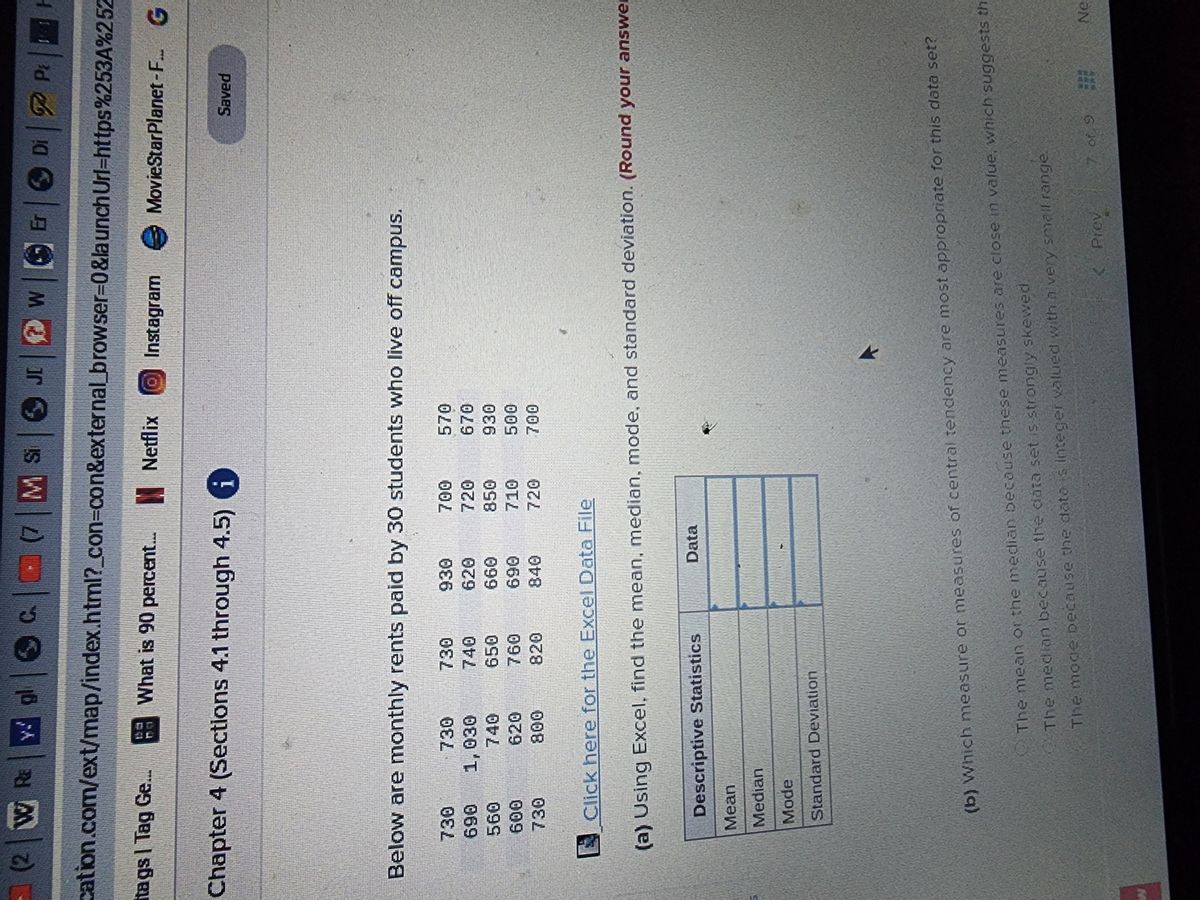
Below are monthly rents paid by 30 students who live off campus.
730
730
730
930
700
570
690
1,030
740
620
720
670
560
740
650
660
850
930
600
620
760
690
710
500
730
800
820
720
700
Click here for the Excel Data File
(a) Using Excel, find the mean, median, mode, and standard deviation. (Round your answer
Descriptive Statistics
Data
Mean
Median
Mode
Standard Deviation
(b) Which measure or measures of central tendency are most appropriate for this data set?
The mean or the median because these measures are close in value, which suggests th
The median because the data set is strongly skewed.
The moge because the data is integer valued with a very small range.
7 of 9
of 9
Ne
< Prev
W
Di | Pr|1
Url=https%253A%252
MovieStarPlanet-F... G
Saved
Expert Solution
This question has been solved!
Explore an expertly crafted, step-by-step solution for a thorough understanding of key concepts.

This is a popular solution

Trending nowThis is a popular solution!

Step by stepSolved in 2 steps

Knowledge Booster

Similar questions
- please answer in fullarrow_forwardThe durations (minutes) of 26 electric power outages in the community of Sonando Heights over the past five years are shown below. 36 49 24 66 25 12 55 12 50 4 14 43 42 102 33 20 14 50 22 2 18 26 89 26 14 20 Click here for the Excel Data File (a) Find the mean, median, and mode. (Round your answers to 2 decimal places.) (b) Are the mean and median about the same? (c) Is the mode a good measure of center for this data set? multiple choice 1 Yes No (d) Is the distribution skewed? multiple choice 2 Yes, the distribution is skewed left. Yes, the distribution is skewed right. No, the distribution is symmetric.arrow_forwardPlease help me answer this question attached below. Thank you.arrow_forward
- Fit a trend line to the following data by the method of semi averages. Also draw the curve for both the original and trend values Jan. Feb. Mar. Apr. May June July Aug. Sept. Oct. Nov. Dec. 24 Month : No. of births: 25 31 27 28 26 25 20 22 21 20 19arrow_forwardI collected data on levels of anxiety after receiving three types of therapies (CBT, psycho education, and psycho analysis). Below are the anxiety scores for 9 patients. Is there a difference in anxiety based on treatment type ? CBT: 3, 2, 0 Psycho Education: 8, 8, 9 Psycho Analysis: 10, 12, 12 (Look at the table)arrow_forwardApproximate the mean for following GFDT. Data Frequency 40 - 44 1 45 - 49 3 50 - 54 5 55 - 59 10 60 - 64 18 65 - 69 11 70 - 74 10 75 - 79 5 80 - 84 1 mean =arrow_forward
- Snape made a deposit of $495 into an account that pays 3% interest compounded annually. How much money is in the bank after 3 years?arrow_forwardEf 30.arrow_forwardThe durations (minutes) of 26 electric power outages in the community of Sonando Heights over the past five years are shown below. 36 49 23 68 26 12 54 13 50 4 14 42 42 101 31 18 13 51 22 3 17 26 91 25 13 20 Click here for the Excel Data File (a) Find the mean, median, and mode. (Round your answers to 2 decimal places.)arrow_forward
arrow_back_ios
arrow_forward_ios
Recommended textbooks for you
- MATLAB: An Introduction with ApplicationsStatisticsISBN:9781119256830Author:Amos GilatPublisher:John Wiley & Sons Inc
 Probability and Statistics for Engineering and th...StatisticsISBN:9781305251809Author:Jay L. DevorePublisher:Cengage Learning
 Statistics for The Behavioral Sciences (MindTap C...StatisticsISBN:9781305504912Author:Frederick J Gravetter, Larry B. WallnauPublisher:Cengage Learning
  Elementary Statistics: Picturing the World (7th E...StatisticsISBN:9780134683416Author:Ron Larson, Betsy FarberPublisher:PEARSON
 The Basic Practice of StatisticsStatisticsISBN:9781319042578Author:David S. Moore, William I. Notz, Michael A. FlignerPublisher:W. H. Freeman
 Introduction to the Practice of StatisticsStatisticsISBN:9781319013387Author:David S. Moore, George P. McCabe, Bruce A. CraigPublisher:W. H. Freeman
MATLAB: An Introduction with Applications
Statistics
ISBN:9781119256830
Author:Amos Gilat
Publisher:John Wiley & Sons Inc
Probability and Statistics for Engineering and th...
Statistics
ISBN:9781305251809
Author:Jay L. Devore
Publisher:Cengage Learning
Statistics for The Behavioral Sciences (MindTap C...
Statistics
ISBN:9781305504912
Author:Frederick J Gravetter, Larry B. Wallnau
Publisher:Cengage Learning
Elementary Statistics: Picturing the World (7th E...
Statistics
ISBN:9780134683416
Author:Ron Larson, Betsy Farber
Publisher:PEARSON
The Basic Practice of Statistics
Statistics
ISBN:9781319042578
Author:David S. Moore, William I. Notz, Michael A. Fligner
Publisher:W. H. Freeman
Introduction to the Practice of Statistics
Statistics
ISBN:9781319013387
Author:David S. Moore, George P. McCabe, Bruce A. Craig
Publisher:W. H. Freeman