
MATLAB: An Introduction with Applications
6th Edition
ISBN: 9781119256830
Author: Amos Gilat
Publisher: John Wiley & Sons Inc
expand_more
expand_more
format_list_bulleted
Related questions
Question
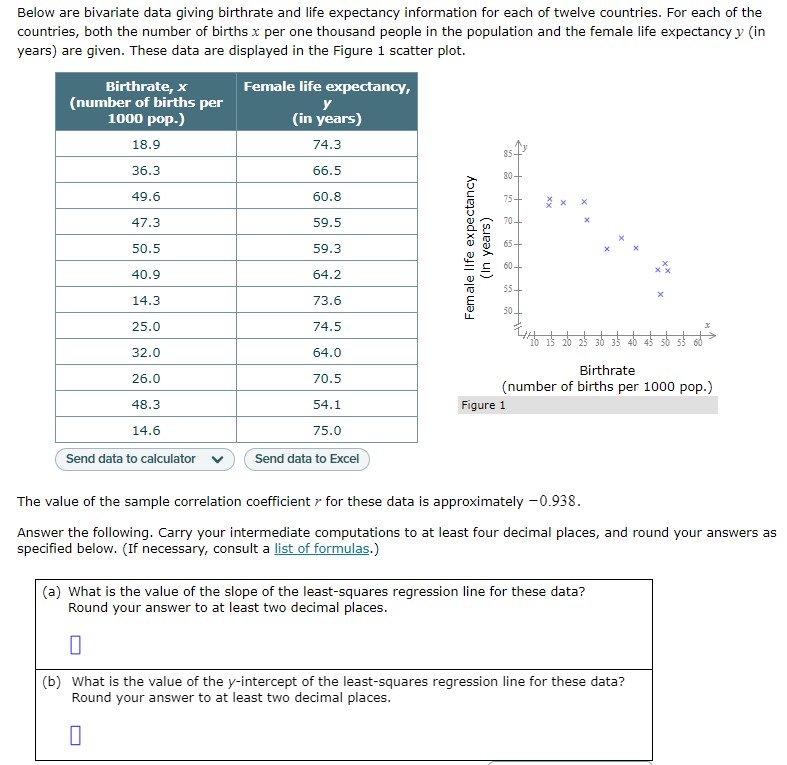

Transcribed Image Text:Below are bivariate data giving birthrate and life expectancy information for each of twelve countries. For each of the
countries, both the number of births x per one thousand people in the population and the female life expectancy y (in
years) are given. These data are displayed in the Figure 1 scatter plot.
Birthrate, x
(number of births per
1000 pop.)
18.9
36.3
49.6
47.3
50.5
40.9
14.3
25.0
32.0
26.0
48.3
14.6
Send data to calculator
Female life expectancy,
y
(in years)
74.3
66.5
60.8
59.5
59.3
64.2
73.6
74.5
64.0
70.5
54.1
75.0
Send data to Excel
Female life expectancy
(In years)
80-
75+
70+
65+
60-
55+
50.
Birthrate
(number of births per 1000 pop.)
Figure 1
The value of the sample correlation coefficient for these data is approximately -0.938.
Answer the following. Carry your intermediate computations to at least four decimal places, and round your answers as
specified below. (If necessary, consult a list of formulas.)
(a) What is the value of the slope of the least-squares regression line for these data?
Round your answer to at least two decimal places.
(b) What is the value of the y-intercept of the least-squares regression line for these data?
Round your answer to at least two decimal places.
0
Expert Solution
This question has been solved!
Explore an expertly crafted, step-by-step solution for a thorough understanding of key concepts.

This is a popular solution

Trending nowThis is a popular solution!

Step by stepSolved in 3 steps

Knowledge Booster

Similar questions
- Using the following stem & leaf plot, find the five number summary for the data by hand. 1|01 2 166 3|16 41 349 5122478 6 14 Min = 10 o Q1 = 41 Med = 37 Q3 = 76 Max = 64 X X Xarrow_forwardUse a calculator or computer software to generate a normal quantile plot for the data in the accompanying table. Then determine whether the data come from a normally distributed population. Click the icon to view the data set. Generate a normal quantile plot for the data. Choose the correct graph below. OA. 3.00 2.00- 1.00- 0.00- -1.00- -2.00- -3.00- 0 100 200 300 400 500 X Value Data table Space Flight Durations (hours) 0 350 100 400 300 200 50 150 200 OB. 3.00- 2.00- Print 1.00- 0.00- -1.00- -2.00- -3.00+ 0 BEELD 100 200 300 400 500 X Value 300 300 200 100 450 200 50 0 0 400 100 450 G Determine whether the data come from a normally distributed population. Choose the correct answer below. OA. The distribution is not normal. The points are not reasonably close to a straight line. OB. The distribution is normal. The points show a systematic pattern that is not a straight-line pattern. OC. The distribution is normal. The points are not reasonably close to a straight line and do not show…arrow_forwardThe table below shows the number of state-registered automatic weapons and the murder rate for several Northwestern states. 11.9 8.5 3.5 2.3 2.7 2.6 0.3 13.8 11.1 10 5.7 6.4 6.4 4.3 I = thousands of automatic weapons y = murders per 100,000 residents This data can be modeled by the equation y = 0.82x + 4.09. Use this equation to answer the following; Special Note: I suggest you verify this equation by performing linear regression on your calculator. A) How many murders per 100,000 residents can be expected in a state with 6 thousand automatic weapons? Answer = Round to 3 decimal places. B) How many murders per 100,000 residents can be expected in a state with 10.6 thousand automatic weapons? Answer = Round to 3 decimal places. Question Help: Video O Message instructor Submit Question 目 hp -> #3 & 4. 8. 00 %24arrow_forward
- A store manager kept track of the number of newspapers sold each week over a seven-week period. The results are shown below. 81 71 202 113 269 248 242 Find the median number of newspapers sold. Question content area bottom Part 1 A. 175 newspapers B. 202 newspapers C. 242 newspapers D. 113 newspapersarrow_forwardThe decrease in cholesterol level (in mg/dL) for ten individuals are listed below. Calculate the range of the data. 16 22 17 18 22 19 21 20 18 23arrow_forwardEyeglassomatic manufactures eyeglasses for different retailers. They test to see how many defective lenses they made the time period of January 1 to March 31. The table gives the defect and the number of defects. Do the data support the notion that each defect type occurs in the same proportion? Test at the 5% level. Number of Defective Lenses Defect type Number of defects Scratch 1866 Right shaped - small 1935 Flaked 1979 Wrong axis 1921 Chamfer wrong 1864 Crazing, cracks 1991 Wrong shape 2004 Wrong PD 1895 Spots and bubbles 1917 Wrong height 1885 Right shape - big 1875 Lost in lab 1886 Spots/bubble - intern 1935 State the hypotheses.H0: Each defect type in the same proportion.Ha: Each defect type in the same proportion. Calculate the χ2 test statistic. Round expected values to two decimal places. Round χ2 to three decimal places.χ2 = Calculate the p-value. Round to four decimal places.p-value = State your decision.Since p-value 0.05,…arrow_forward
- I need the right answer for a and b.arrow_forwardPart II. The data below represents the weights (in kgs) of a sample of 20 giant turtles: 61 65 67 67 69 73 74 74 74 77 77 78 80 84 88 89 92 93 95 96 1. Construct a Stem-and-Leaf display of this data based on the stems 6, 7, 8, 9. 2. Find the percentage of weights greater than or equal to 73 kgs. 3. Find the percentage of weights less than 80 kgs.arrow_forwardDraw a box plot for the data set with the statistics in the picturearrow_forward
- dear sir mam how do u create a steam and leaf data plotarrow_forwardResearchers wondered whether the size of a person's brain was related to the individual's mental capacity. They selected a sample of 5 females and 5 males and measured their MRI image pixel counts and IQ scores. Females Males MRI IQ MRI IG The data is reported to the right. Complete parts (a) through (d) below 139 858,472 140 955,003 935,494 924,059 1.079.550 1,001.121 Click the icon to view the critical values table. 991,305 138 141 857,782 833,868 790,619 133 135 132 141 135 140 AMRI 1,080,000- AIO 145 AIO 145- AMRI 1,080,000 780,000 130 130 780,000 130 780,000 780,000 130 1,080,000 145 1,080,000 MRI 145 MRI (b) Compute the linear correlation coefficient between MRI count and IQ. Are MRI count and IQ linearly related? Select the correct choice below and, if necessary, fill in the answer box to complete your choice. (Round to three decimal places as needed.) A. Yes, MRI count and IQ are linearly related since the linear correlation coefficient is O B. No. MRI count and IQ are not…arrow_forwardUsing the following stem & leaf plot, find the five number summary for the data. 0 2 3 4 4 5 9 3 4 2 2 79 0 45 6 89 6 0 8 Min = Q1 Med = Q3 = %3D Max =arrow_forward
arrow_back_ios
SEE MORE QUESTIONS
arrow_forward_ios
Recommended textbooks for you
- MATLAB: An Introduction with ApplicationsStatisticsISBN:9781119256830Author:Amos GilatPublisher:John Wiley & Sons Inc
 Probability and Statistics for Engineering and th...StatisticsISBN:9781305251809Author:Jay L. DevorePublisher:Cengage Learning
 Statistics for The Behavioral Sciences (MindTap C...StatisticsISBN:9781305504912Author:Frederick J Gravetter, Larry B. WallnauPublisher:Cengage Learning
  Elementary Statistics: Picturing the World (7th E...StatisticsISBN:9780134683416Author:Ron Larson, Betsy FarberPublisher:PEARSON
 The Basic Practice of StatisticsStatisticsISBN:9781319042578Author:David S. Moore, William I. Notz, Michael A. FlignerPublisher:W. H. Freeman
 Introduction to the Practice of StatisticsStatisticsISBN:9781319013387Author:David S. Moore, George P. McCabe, Bruce A. CraigPublisher:W. H. Freeman
MATLAB: An Introduction with Applications
Statistics
ISBN:9781119256830
Author:Amos Gilat
Publisher:John Wiley & Sons Inc
Probability and Statistics for Engineering and th...
Statistics
ISBN:9781305251809
Author:Jay L. Devore
Publisher:Cengage Learning
Statistics for The Behavioral Sciences (MindTap C...
Statistics
ISBN:9781305504912
Author:Frederick J Gravetter, Larry B. Wallnau
Publisher:Cengage Learning
Elementary Statistics: Picturing the World (7th E...
Statistics
ISBN:9780134683416
Author:Ron Larson, Betsy Farber
Publisher:PEARSON
The Basic Practice of Statistics
Statistics
ISBN:9781319042578
Author:David S. Moore, William I. Notz, Michael A. Fligner
Publisher:W. H. Freeman
Introduction to the Practice of Statistics
Statistics
ISBN:9781319013387
Author:David S. Moore, George P. McCabe, Bruce A. Craig
Publisher:W. H. Freeman