Advanced Engineering Mathematics
10th Edition
ISBN: 9780470458365
Author: Erwin Kreyszig
Publisher: Wiley, John & Sons, Incorporated
expand_more
expand_more
format_list_bulleted
Question
Don’t use calculus

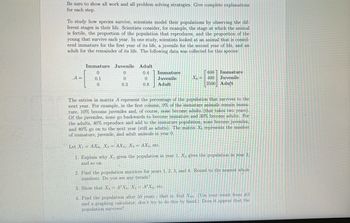
Transcribed Image Text:Be sure to show all work and all problem solving strategies. Give complete explanations
for each step.
To study how species survive, scientists model their populations by observing the dif-
ferent stages in their life. Scientists consider, for example, the stage at which the animal
is fertile, the proportion of the population that reproduces, and the proportion of the
young that survive each year. In one study, scientists looked at an animal that is consid-
ered immature for the first year of its life, a juvenile for the second year of life, and an
adult for the remainder of its life. The following data was collected for this species:
Immature
0
Juvenile
0
0
Adult
0.4
0
A =
0.1
Immature
Juvenile
Adult
Xo =
600 Immature
400 Juvenile
3500 Adult
0
0.3
0.8
The entries in matrix A represent the percentage of the population that survives to the
next year. For example, in the first column, 0% of the immature animals remain imma-
ture, 10% become juveniles and, of course, none become adults (that takes two years)
Of the juveniles, none go backwards to become immature and 30% become adults. For
the adults, 40% reproduce and add to the immature population, none become juveniles,
and 80% go on to the next year (still as adults). The matrix Xo represents the number
of immature, juvenile, and adult animals in year 0.
Let X₁ = AXo, X2= AX1, X3 = AX2, etc.
1. Explain why X₁ gives the population in year 1, X₂ gives the population in year 2,
and so on.
2. Find the population matrices for years 1, 2, 3, and 4. Round to the nearest whole
numbers. Do you see any trends?
3. Show that X₂ = A²X0, X3 = A³ Xo, etc.
4. Find the population after 50 years that is, find X50. (Use your result from #3
and a graphing calculator, don't try to do this by hand.) Does it appear that the
population survives?
Expert Solution
This question has been solved!
Explore an expertly crafted, step-by-step solution for a thorough understanding of key concepts.
This is a popular solution
Trending nowThis is a popular solution!
Step by stepSolved in 8 steps

Knowledge Booster
Similar questions
Recommended textbooks for you
 Advanced Engineering MathematicsAdvanced MathISBN:9780470458365Author:Erwin KreyszigPublisher:Wiley, John & Sons, Incorporated
 Numerical Methods for EngineersAdvanced MathISBN:9780073397924Author:Steven C. Chapra Dr., Raymond P. CanalePublisher:McGraw-Hill Education
 Introductory Mathematics for Engineering Applicat...Advanced MathISBN:9781118141809Author:Nathan KlingbeilPublisher:WILEY
 Mathematics For Machine TechnologyAdvanced MathISBN:9781337798310Author:Peterson, John.Publisher:Cengage Learning,


Advanced Engineering Mathematics
Advanced Math
ISBN:9780470458365
Author:Erwin Kreyszig
Publisher:Wiley, John & Sons, Incorporated

Numerical Methods for Engineers
Advanced Math
ISBN:9780073397924
Author:Steven C. Chapra Dr., Raymond P. Canale
Publisher:McGraw-Hill Education

Introductory Mathematics for Engineering Applicat...
Advanced Math
ISBN:9781118141809
Author:Nathan Klingbeil
Publisher:WILEY

Mathematics For Machine Technology
Advanced Math
ISBN:9781337798310
Author:Peterson, John.
Publisher:Cengage Learning,

