
MATLAB: An Introduction with Applications
6th Edition
ISBN: 9781119256830
Author: Amos Gilat
Publisher: John Wiley & Sons Inc
expand_more
expand_more
format_list_bulleted
Related questions
Concept explainers
Question
thumb_up100%
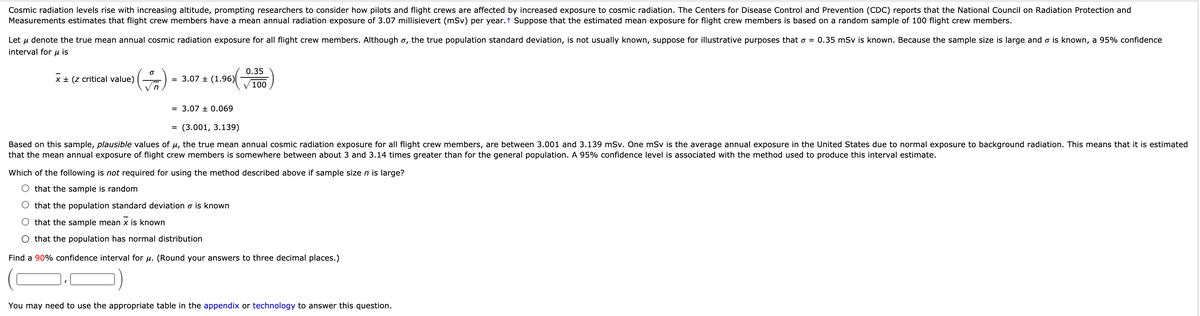

Transcribed Image Text:Cosmic radiation levels rise with increasing altitude, prompting researchers to consider how pilots and flight crews are affected by increased exposure to cosmic radiation. The Centers for Disease Control and Prevention (CDC) reports that the National Council on Radiation Protection and
Measurements estimates that flight crew members have a mean annual radiation exposure of 3.07 millisievert (mSv) per year.t Suppose that the estimated mean exposure for flight crew members is based on a random sample of 100 flight crew members.
Let u denote the true mean annual cosmic radiation exposure for all flight crew members. Although o, the true population standard deviation, is not usually known, suppose for illustrative purposes that o = 0.35 mSv is known. Because the sample size is large and o is known, a 95% confidence
interval for u is
0.35
x + (z critical value)
= 3.07 + (1.96)
100
= 3.07 ± 0.069
(3.001, 3.139)
Based on this sample, plausible values of u, the true mean annual cosmic radiation exposure for all flight crew members, are between 3.001 and 3.139 mSv. One mSv is the average annual exposure in the United States due to normal exposure to background radiation. This means that it is estimated
that the mean annual exposure of flight crew members is somewhere between about 3 and 3.14 times greater than for the general population. A 95% confidence level is associated with the method used to produce this interval estimate.
Which of the following is
required for using the method described above if sample size n is large?
O that the sample is random
that the population standard deviation o is known
that the sample mean x is known
that the population has normal distribution
Find a 90% confidence interval for u. (Round your answers to three decimal places.)
You may need to use the appropriate table in the appendix or technology to answer this question.
Expert Solution
This question has been solved!
Explore an expertly crafted, step-by-step solution for a thorough understanding of key concepts.

This is a popular solution

Trending nowThis is a popular solution!

Step by stepSolved in 2 steps with 3 images

Knowledge Booster


Learn more about
Need a deep-dive on the concept behind this application? Look no further. Learn more about this topic, statistics and related others by exploring similar questions and additional content below.Similar questions
- A random sample of size 15 taken from a normally distributed population revealed a sample mean of 75 and a sample variance of 25. The upper limit of a 95% confidence interval for the population mean would equal?arrow_forwardSuppose that the true population standard deviation (this assumption is made only for this question, ) is known to be equal to 3. in order to construct a 95% confidence interval of width = 1, how large a sample do you need to collect?arrow_forwardUse the sample information x⎯⎯x¯ = 35, σ = 7, n = 16 to calculate the following confidence intervals for μ assuming the sample is from a normal population.arrow_forward
- Find the value of tal2 and n = 25 for the %3D 90% confidence interval for the mean if the population standard deviation, ơ, is not known.arrow_forwardBased on a sample of size 49, a 95% confidence interval for the mean scaore of all students, u, on an aptitude is from 59.2 to 64.8. Find the margin of error.arrow_forwardA confidence interval for (μ1−μ2) is (-5, 8). Which of the following inferences is correct? Question 8 options: no significant difference between means μ1=μ2 μ1>μ2 μ1arrow_forward
- please give answer to 5 decimal places. image attached.arrow_forwardSuppose that the population of lengths of all fully grown male killer whales is approximately normally distributed. A recent article published in the Zoology Now journal claims that the mean of this population is 6.99 m. You want to test the claim made in the article, so you select a random sample of 10 fully grown male killer whales and record the length of each. Follow the steps below to construct a 90% confidence interval for the population mean of all lengths of fully grown male killer whales. Then state whether the confidence interval you construct contradicts the article's claim. (If necessary, consult a list of formulas.) (a) Click on "Take Sample" to see the results for your random sample. (b) Take Sample Point estimate: 0 Sample standard deviation: 0 Critical value: 0 Compute Enter the values of the sample size, the point estimate of the mean, the sample standard deviation, and the critical value you need for your 90% confidence interval. (Choose the correct critical value…arrow_forwardA sample of marine iguanas (n=30) from the Galapagos Islands has an average length of 2.8ft with a sample variance of 0.43ft. What is the 95% confidence interval of this sample?arrow_forward
- The concentration of an additive in a standard sample of gasoline was measured 5 times with the following results: 0.13, 0.11, 0.12, 0.20, and 0.14 % by mass.Calculate the arithmetic average (mean) and standard deviation of the data.Calculate the 95% confidence interval.If the accepted value for the standard sample is 0.11 % by mass, are the results for this set of measurements be significantly different at the 95% confidence level by the t test.Can any of the data be rejected by the Q test?arrow_forwardA study found that a 95% confidence interval for the mean μ of a particular population was computed from a random sample of 1200 people and found it to be 10 ± 4. Therefore, we may conclude:arrow_forwardA random sample of 78 measurements was selected from a population with ?=2.76σ=2.76. The sample mean was 122.5. Calculate a 99% confidence interval for ?arrow_forward
arrow_back_ios
SEE MORE QUESTIONS
arrow_forward_ios
Recommended textbooks for you
- MATLAB: An Introduction with ApplicationsStatisticsISBN:9781119256830Author:Amos GilatPublisher:John Wiley & Sons Inc
 Probability and Statistics for Engineering and th...StatisticsISBN:9781305251809Author:Jay L. DevorePublisher:Cengage Learning
 Statistics for The Behavioral Sciences (MindTap C...StatisticsISBN:9781305504912Author:Frederick J Gravetter, Larry B. WallnauPublisher:Cengage Learning
  Elementary Statistics: Picturing the World (7th E...StatisticsISBN:9780134683416Author:Ron Larson, Betsy FarberPublisher:PEARSON
 The Basic Practice of StatisticsStatisticsISBN:9781319042578Author:David S. Moore, William I. Notz, Michael A. FlignerPublisher:W. H. Freeman
 Introduction to the Practice of StatisticsStatisticsISBN:9781319013387Author:David S. Moore, George P. McCabe, Bruce A. CraigPublisher:W. H. Freeman
MATLAB: An Introduction with Applications
Statistics
ISBN:9781119256830
Author:Amos Gilat
Publisher:John Wiley & Sons Inc
Probability and Statistics for Engineering and th...
Statistics
ISBN:9781305251809
Author:Jay L. Devore
Publisher:Cengage Learning
Statistics for The Behavioral Sciences (MindTap C...
Statistics
ISBN:9781305504912
Author:Frederick J Gravetter, Larry B. Wallnau
Publisher:Cengage Learning
Elementary Statistics: Picturing the World (7th E...
Statistics
ISBN:9780134683416
Author:Ron Larson, Betsy Farber
Publisher:PEARSON
The Basic Practice of Statistics
Statistics
ISBN:9781319042578
Author:David S. Moore, William I. Notz, Michael A. Fligner
Publisher:W. H. Freeman
Introduction to the Practice of Statistics
Statistics
ISBN:9781319013387
Author:David S. Moore, George P. McCabe, Bruce A. Craig
Publisher:W. H. Freeman