ENGR.ECONOMIC ANALYSIS
14th Edition
ISBN: 9780190931919
Author: NEWNAN
Publisher: Oxford University Press
expand_more
expand_more
format_list_bulleted
infoPractice Pack
Question
infoPractice Pack
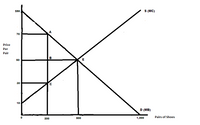
Based on this graph,Calculate the

Transcribed Image Text:$90
S (MC)
70
Price
Per
Pair
B
50
E
30
10
D (MB)
Pairs of Shoes
200
500
1,000
Expert Solution
This question has been solved!
Explore an expertly crafted, step-by-step solution for a thorough understanding of key concepts.
This is a popular solution
Includes step-by-step video
Trending nowThis is a popular solution!
Learn your wayIncludes step-by-step video
Step by stepSolved in 2 steps

Knowledge Booster
Learn more about
Need a deep-dive on the concept behind this application? Look no further. Learn more about this topic, economics and related others by exploring similar questions and additional content below.Similar questions
- Consider the same apple-juice market. Suppose now, the demand curve a liter of apple-juice is given by: P = 107 - 5QD. i. Calculate the price elasticity of demand of apple-juice when price rises from 55 to 80. Give your answer in two decimal places. After the price rise, the income of a person goes up from 31033 to 46187. The new demand curve is P = 132 - 5QD. ii. Calculate the income elasticity of demand. Give your answer in two decimal places. iii. Due to this increase income, has demand become more or less elastic? More elastic Less elastic Income and demand elasticity are not related Not enough information given iv. If the increase in income (and the subsequent shift of the demand curve) had occurred before the rise in price, what would the YED be? Give your answer in two decimal places.arrow_forwardPlease read attached article and then use it to answer the following questions. Do companies prefer to sell products that are more elastic or more inelastic? Briefly explain. What does the article describe as the best way to calculate price elasticity, and what other information is relevant to inform marketing efforts? Suppose a marketing company runs a market test and finds that the price elasticity equals -0.6. Would a company be more inclined to increase or to decrease price given this elasticity? Explain what would happen to quantity purchased (by how much it would change) and total revenue (would it increase, decrease, or stay the same) if the company were to decrease price by 10%.arrow_forwardA company named The Mad Hatter decides to increase the price of its hats from $26 to $47 per hat. As a result of this change, the quantity demanded of hats drops from 195 to 144 hats. What is the price elasticity of demand for its hats? (Use the midpoint method for your calculations and round your answer to two decimal places.)arrow_forward
- Describe the concept of price elasticity?arrow_forwardThe following graph gives two points (A and B) along a hypothetical demand curve for tofu. PRICE (Dollars per pound) 12 11 10 9 1 0 0 10 + B A Demand 20 30 40 50 60 70 80 QUANTITY (Thousands of pounds of tofu) 90 100 110 Using the midpoint method, the price elasticity of demand for tofu between point A and point B is approximately tofu is between points A and B. This indicates that demand forarrow_forwardBorder Crossings from the USA into British Columbia , Canada Up 15 Percent Cheap gasoline brought 964,000 American visitors through border crossings in B.C. during the first four months of 2016, a 15 percent increase from the previous year. (Source: Vancouver Sun, July 9, 2016) The U.S. energy Information Administration reports the average price of gasoline was $2.83 a gallon in July 2015 and $2.22 a gallon in July 2016. Calculate the price elasticity of demand for British Columbia border crossings and interpret your results in non-economic terms With COVID-19 and the temporary closure of the Canada-US border to non-essential travel, is the concept of price elasticity of demand still relevant to doing business in Canada, especially in the travel and tourism sector? Explain briefly.arrow_forward
- use a graph to illustrate the relevant category of elasticity of supply for chocolatearrow_forwardWhat is the connection between elasticity and total revenue?arrow_forwardThe quantity demanded for product A increases 8% when the price of product B increases 16% and the other variables remain the same. Calculate the cross elasticity of demand. Products A and B, are they complementary or substitutes? Why? By drawing a graph, show the change in the demand curve for product A as a result of the change in the price of product B.arrow_forward
arrow_back_ios
SEE MORE QUESTIONS
arrow_forward_ios
Recommended textbooks for you

 Principles of Economics (12th Edition)EconomicsISBN:9780134078779Author:Karl E. Case, Ray C. Fair, Sharon E. OsterPublisher:PEARSON
 Engineering Economy (17th Edition)EconomicsISBN:9780134870069Author:William G. Sullivan, Elin M. Wicks, C. Patrick KoellingPublisher:PEARSON
 Principles of Economics (MindTap Course List)EconomicsISBN:9781305585126Author:N. Gregory MankiwPublisher:Cengage Learning
 Managerial Economics: A Problem Solving ApproachEconomicsISBN:9781337106665Author:Luke M. Froeb, Brian T. McCann, Michael R. Ward, Mike ShorPublisher:Cengage Learning
 Managerial Economics & Business Strategy (Mcgraw-...EconomicsISBN:9781259290619Author:Michael Baye, Jeff PrincePublisher:McGraw-Hill Education


Principles of Economics (12th Edition)
Economics
ISBN:9780134078779
Author:Karl E. Case, Ray C. Fair, Sharon E. Oster
Publisher:PEARSON

Engineering Economy (17th Edition)
Economics
ISBN:9780134870069
Author:William G. Sullivan, Elin M. Wicks, C. Patrick Koelling
Publisher:PEARSON

Principles of Economics (MindTap Course List)
Economics
ISBN:9781305585126
Author:N. Gregory Mankiw
Publisher:Cengage Learning

Managerial Economics: A Problem Solving Approach
Economics
ISBN:9781337106665
Author:Luke M. Froeb, Brian T. McCann, Michael R. Ward, Mike Shor
Publisher:Cengage Learning

Managerial Economics & Business Strategy (Mcgraw-...
Economics
ISBN:9781259290619
Author:Michael Baye, Jeff Prince
Publisher:McGraw-Hill Education