MATLAB: An Introduction with Applications
6th Edition
ISBN: 9781119256830
Author: Amos Gilat
Publisher: John Wiley & Sons Inc
expand_more
expand_more
format_list_bulleted
Concept explainers
Question

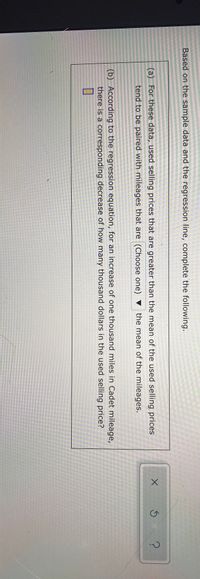
Transcribed Image Text:Based on the sample data and the regression line, complete the following.
(a) For these data, used selling prices that are greater than the mean of the used selling prices
tend to be paired with mileages that are (Choose one) ▼ the mean of the mileages.
(b) According to the regression equation, for an increase of one thousand miles in Cadet mileage,
there is a corresponding decrease of how many thousand dollars in the used selling price?

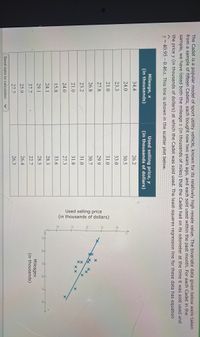
Transcribed Image Text:Used selling price
(in thousands of dollars)
XX
The Cadet is a popular model of sport utility vehicle, known for its relatively high resale value. The bivariate data given below were taken
from a sample of fifteen Cadets, each bought new two years ago, and each sold used within the past month. For each Cadet in the!
sample, we have listed both the mileage x (in thousands of miles) that the Cadet had on its odometer at the time it was sold used and
the price y (in thousands of dollars) at which the Cadet was sold used. The least-squares regression line for these data has equation
y = 40.95 – 0.46x. This line is shown in the scatter plot below.
Mileage, x
(in thousands)
Used selling price, y
(in thousands of dollars)
34.4
26.2
24.0
30.5
40-
23.3
33.0
21.0
31.0
35 -
27.8
29.9
メ
26.8
30.7
++
30
23.2
31.0
X X
21.0
31.8
25
27.3
24.0
20.
33.6
15.8
28.3
24.1
20
25
30
35
40
15
28.5
Mileagex
(in thousands)
29.1
22.7
37.7
26.4
25.9
26.3
27.7
Send data to calculator
Expert Solution
This question has been solved!
Explore an expertly crafted, step-by-step solution for a thorough understanding of key concepts.
This is a popular solution
Trending nowThis is a popular solution!
Step by stepSolved in 3 steps with 1 images

Knowledge Booster
Learn more about
Need a deep-dive on the concept behind this application? Look no further. Learn more about this topic, statistics and related others by exploring similar questions and additional content below.Similar questions
- Need help with part d only? The slope and average is?arrow_forwardPlease no written by hand solutions 3. A researcher is interested in the correlation between a person’s age and the amount of sleep they get. He uses a poll to collect representative data for 2,000 people. The researcher performs a regression, with a dependent variable of minutes per week spent sleeping, and an independent variable of age in years. The regression results are as follows: - (Intercept): 150 - age: -5 Answer the following: - What is the regression line? - What is the predicted number of minutes sleeping for someone who is 20 years old? - The researcher is also interested in the relationship between age, sleep, and politics. Each person who responds to the poll chooses a value for liberal between 0 (very conservative) and 100 (very liberal) to describe their politics. The researcher performs a regression with the same independent variable of minutes per week sleeping, and dependent variables of age and liberal. The regression results are as follows: - (Intercept):…arrow_forwardThe datasetBody.xlsgives the percent of weight made up of body fat for 100 men as well as other variables such as Age, Weight (lb), Height (in), and circumference (cm) measurements for the Neck, Chest, Abdomen, Ankle, Biceps, and Wrist. We are interested in predicting body fat based on abdomen circumference. Find the equation of the regression line relating to body fat and abdomen circumference. Make a scatter-plot with a regression line. What body fat percent does the line predict for a person with an abdomen circumference of 110 cm? One of the men in the study had an abdomen circumference of 92.4 cm and a body fat of 22.5 percent. Find the residual that corresponds to this observation. Bodyfat Abdomen 32.3 115.6 22.5 92.4 22 86 12.3 85.2 20.5 95.6 22.6 100 28.7 103.1 21.3 89.6 29.9 110.3 21.3 100.5 29.9 100.5 20.4 98.9 16.9 90.3 14.7 83.3 10.8 73.7 26.7 94.9 11.3 86.7 18.1 87.5 8.8 82.8 11.8 83.3 11 83.6 14.9 87 31.9 108.5 17.3…arrow_forward
- Listed below are the numbers of commuters and the number of parking spaces at different Metro-North railroad stations. Use technology (calculator) to help you answer the following, and round to the 3 decimal places where rounding is necessary. . a. Find the linear regression line y = a + bx. b. Are the variables positively or negatively related? c. Find and interpret r2. Make sure to include what it means specific to this data set. d. Use your regression line to make a prediction for the number of parking spaces for a station with 900 e. Identify and interpret the slope of the linear model.arrow_forwardIn regression, the larger (stronger) the correlation between Y and X, the 1. smaller the standard error of estimate and the greater the accuracy of prediction. 2.greater the standard error of estimate and the smaller the accuracy of prediction 3.greater the standard error of estimate and the greater the accuracy of prediction 4.smaller the standard error of estimate and the smaller the accuracy of prediction.arrow_forwardWhich is correct?arrow_forward
- Use the scatterplot of Vehicle Registrations below to answer the questions Vehicle Registrations in the United States, 1925- 2011 Vehicles millions 300 y = 3.0161x - 5819.5 R? = 0.9695 250 200 150 100 50 1920 -50 1940 1960 1980 2000 2020 Year Write a sentence explaining the value of the slope for this regression line. For every increase in year, the number of vehicle registrations in the US increases by 3.0161 million. For every increase in year, the number of vehicle registrations in the US increases by 5819.5. For every increase in vehicle registrations in the US, the number of years increases by 5819.5. For every increase in vehicle registrations in the US, the number of years increases by 3.0161 million. Registrations (in millions)arrow_forwardPa.n.narrow_forwardI’m taking a statistics and probability class. Please get this correct because I want to learn. I have gotten wrong answers on here beforearrow_forward
- Using the data, run a regression where you control for “Promotion,” and test the effect of “Wins” on “Attendance”. What should be the attendance if the number of wins is 10? Wins Promotion Attendance 4 29500 36300 6 55700 40100 6 71300 41200 8 87000 53000 6 75000 44000 7 72000 45600 5 55300 39000 7 81600 47500arrow_forwardPersonal wealth tends to increase with age as older individuals have had more opportunities to earn and invest than younger individuals. The following data were obtained from a random sample of eight individuals and records their total wealth (Y) and their current age (X). Data provided in the image. a. State the estimated regression line and interpret the slope coefficient.b. What is the estimated total personal wealth when a person is 50 years old?c. What is the value of the coefficient of determination? Interpret it. d. Test whether there is a significant relationship between wealth and age at the 10%significance level. Perform the test using the following six steps. Step 1. Statement of the hypothesesStep 2. Standardised test statisticStep 3. Level of significanceStep 4. Decision. Step 5. Calculation of test statistic. Step 6. Conclusion Please solve the d) part only.arrow_forwardplease use chart attatched. a. Explain the meaning of the slope of the regression line in this context. b. What is the predicted cost of maintenance for someone who racks up about 2,000 miles per month on a sedan? c. Suppose one of the observations used to get the data table above was a sedan owner who reported he drove 980 miles this month and spent about $450 on maintenance costs in the same month. What is the residual of this observation?arrow_forward
arrow_back_ios
SEE MORE QUESTIONS
arrow_forward_ios
Recommended textbooks for you
 MATLAB: An Introduction with ApplicationsStatisticsISBN:9781119256830Author:Amos GilatPublisher:John Wiley & Sons Inc
 Probability and Statistics for Engineering and th...StatisticsISBN:9781305251809Author:Jay L. DevorePublisher:Cengage Learning
 Statistics for The Behavioral Sciences (MindTap C...StatisticsISBN:9781305504912Author:Frederick J Gravetter, Larry B. WallnauPublisher:Cengage Learning
 Elementary Statistics: Picturing the World (7th E...StatisticsISBN:9780134683416Author:Ron Larson, Betsy FarberPublisher:PEARSON
 The Basic Practice of StatisticsStatisticsISBN:9781319042578Author:David S. Moore, William I. Notz, Michael A. FlignerPublisher:W. H. Freeman
 Introduction to the Practice of StatisticsStatisticsISBN:9781319013387Author:David S. Moore, George P. McCabe, Bruce A. CraigPublisher:W. H. Freeman

MATLAB: An Introduction with Applications
Statistics
ISBN:9781119256830
Author:Amos Gilat
Publisher:John Wiley & Sons Inc

Probability and Statistics for Engineering and th...
Statistics
ISBN:9781305251809
Author:Jay L. Devore
Publisher:Cengage Learning

Statistics for The Behavioral Sciences (MindTap C...
Statistics
ISBN:9781305504912
Author:Frederick J Gravetter, Larry B. Wallnau
Publisher:Cengage Learning

Elementary Statistics: Picturing the World (7th E...
Statistics
ISBN:9780134683416
Author:Ron Larson, Betsy Farber
Publisher:PEARSON

The Basic Practice of Statistics
Statistics
ISBN:9781319042578
Author:David S. Moore, William I. Notz, Michael A. Fligner
Publisher:W. H. Freeman

Introduction to the Practice of Statistics
Statistics
ISBN:9781319013387
Author:David S. Moore, George P. McCabe, Bruce A. Craig
Publisher:W. H. Freeman