Holt Mcdougal Larson Pre-algebra: Student Edition 2012
1st Edition
ISBN: 9780547587776
Author: HOLT MCDOUGAL
Publisher: HOLT MCDOUGAL
expand_more
expand_more
format_list_bulleted
Question
How can we conclude?

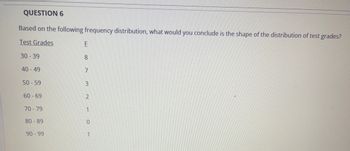
Transcribed Image Text:QUESTION 6
Based on the following frequency distribution, what would you conclude is the shape of the distribution of test grades?
Test Grades
F
30-39
8
40-49
7
50-59
3
60-69
2
70-79
1
80-89
0
90-99
1
Expert Solution
This question has been solved!
Explore an expertly crafted, step-by-step solution for a thorough understanding of key concepts.
Step by stepSolved in 3 steps with 1 images

Knowledge Booster
Recommended textbooks for you
 Holt Mcdougal Larson Pre-algebra: Student Edition...AlgebraISBN:9780547587776Author:HOLT MCDOUGALPublisher:HOLT MCDOUGAL
 Glencoe Algebra 1, Student Edition, 9780079039897...AlgebraISBN:9780079039897Author:CarterPublisher:McGraw Hill

Holt Mcdougal Larson Pre-algebra: Student Edition...
Algebra
ISBN:9780547587776
Author:HOLT MCDOUGAL
Publisher:HOLT MCDOUGAL

Glencoe Algebra 1, Student Edition, 9780079039897...
Algebra
ISBN:9780079039897
Author:Carter
Publisher:McGraw Hill