
MATLAB: An Introduction with Applications
6th Edition
ISBN: 9781119256830
Author: Amos Gilat
Publisher: John Wiley & Sons Inc
expand_more
expand_more
format_list_bulleted
Related questions
Question
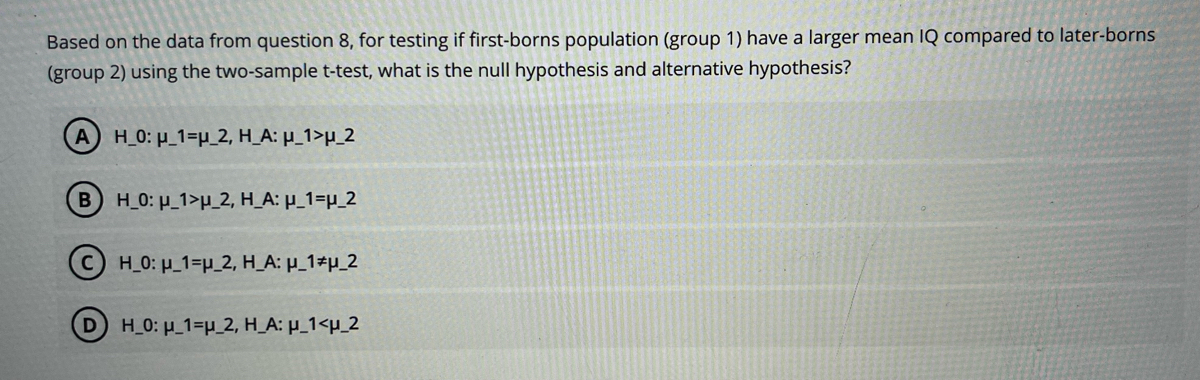

Transcribed Image Text:Based on the data from question 8, for testing if first-borns population (group 1) have a larger mean IQ compared to later-borns
(group 2) using the two-sample t-test, what is the null hypothesis and alternative hypothesis?
A) H_0: μ_1=u_2, H_A: μ_1>u_2
BH_0: _1>μ_2, H_A: µ_1=µ_2
CH_0: μ_1-p_2, H_A: μ_1 p_2
(D) H_0: μ_1=H_2, H_A: μ_1<μ_2

Transcribed Image Text:Use the following data to answer question 8 - 12. A number of studies have claimed evidence that the first-born in a family is, on
the whole, more likely to be "successful" than later-borns. A study along this direction compared the IQs of a random sample of 80
first-borns with those of an independent random sample of 105 later-borns. The data are summarized below:
Sample size
Sample mean
Sample SD
First-borns
80
112
7.2
Later-borns
105
108
8.0
Expert Solution
This question has been solved!
Explore an expertly crafted, step-by-step solution for a thorough understanding of key concepts.

Step by stepSolved in 2 steps with 2 images

Knowledge Booster

Similar questions
- Can I receive some assistance on question 11 please?arrow_forwardWhere are the critical region(s) located in a z-distribution if a two-tailed hypothesis test was conducted using an alpha = 0.0892? Report the complete z-score (no rounding)arrow_forwardThe null and alternative hypotheses for a test are given, as well as some information about the actual sample and the statistic that is computed for each randomization sample. H0:μ=20H0:μ=20 vs Ha:μ>20Ha:μ>20Sample: x_=12x_=12, s=3.8s=3.8, n=40n=40Randomization statistic: x_ (a) Indicate where the randomization distribution will be centered. (b) Indicate whether the test is a left-tail test, a right-tail test, or a two-tailed test.arrow_forward
- A researcher used a sample of n = 50 individuals to determine whether there are any preferences between two new designs for a smartphone. If the data produce a chi-square statistic of X^2 = 6.00, what decision should the researcher make (indicate df and decisions with a=.05 and a =.01 by reporting critical values)arrow_forwardThe null and alternative hypotheses for a test are given, as well as some information about the actual sample and the statistic that is computed for each randomization sample. H0:μ=30H0:μ=30 vs Ha:μ≠30Ha:μ≠30Sample: x_=12x_=12, s=3.8s=3.8, n=40n=40Randomization statistic: x_x_ (a) Indicate where the randomization distribution will be centered. (b) Indicate whether the test is a left-tail test, a right-tail test, or a two-tailed test.arrow_forwardConduct a two-factor ANOVA to examine the effects of 'maternal diet' (‘diet’: No alcohol, vs. alcohol) and age (adolescent rat vs. adult rat) on passive avoidance (‘pa’). State the three alternative hypotheses in words. State the alternative hypothesis of the interaction in terms of whether the effects of maternal diet (alcohol vs. not alcohol) on passive avoidance depend on the levels of age (i.e., on whether the rat is an adolescent or an adult rat).arrow_forward
- Select a significance level α and reject the null-hypothesis if the p-value is less than α. Explain, in complete sentences, your findings: Is there a statistically significant association (at α level) between the provided genes? What is the magnitude and the direction of the association?arrow_forwardA research center claims that 31% of adults in a certain country would travel into space on a commercial flight if they could afford it. In a random sample of 700 adults in that country, 35% say that they would travel into space on a commercial flight if they could afford it. At α=0.10, is there enough evidence to reject the research center's claim? identify the standardized test statisticz= find the P valueP= decide whether to reject or fail to reject the null hypothesisarrow_forwardAn aerosolized vaccine for measles was developed in Mexico and has been used on more than 44 million children since 1980. Aerosolized vaccines have the advantages of being able to be administered by people without clinical training and do not cause injection‑associated infections. Despite these advantages, data about efficacy of the aerosolized vaccines against measles compared to subcutaneous injection of the vaccine have been inconsistent. Because of this, a large randomized controlled study was conducted with children in India. The primary outcome was an immune response to measles measured 91 days after the treatments. Among the 785 children receiving the subcutaneous injection, 743 developed an immune response, while among the 775 children receiving the aerosolized vaccine, 662 developed an immune response. Nicola Low et al., "A randomized, controlled trial of an aerosolized vaccine against measles," New England Journal of Medicine, 372 (2015), pp. 1519–1529. Compute the…arrow_forward
arrow_back_ios
arrow_forward_ios
Recommended textbooks for you
- MATLAB: An Introduction with ApplicationsStatisticsISBN:9781119256830Author:Amos GilatPublisher:John Wiley & Sons Inc
 Probability and Statistics for Engineering and th...StatisticsISBN:9781305251809Author:Jay L. DevorePublisher:Cengage Learning
 Statistics for The Behavioral Sciences (MindTap C...StatisticsISBN:9781305504912Author:Frederick J Gravetter, Larry B. WallnauPublisher:Cengage Learning
  Elementary Statistics: Picturing the World (7th E...StatisticsISBN:9780134683416Author:Ron Larson, Betsy FarberPublisher:PEARSON
 The Basic Practice of StatisticsStatisticsISBN:9781319042578Author:David S. Moore, William I. Notz, Michael A. FlignerPublisher:W. H. Freeman
 Introduction to the Practice of StatisticsStatisticsISBN:9781319013387Author:David S. Moore, George P. McCabe, Bruce A. CraigPublisher:W. H. Freeman
MATLAB: An Introduction with Applications
Statistics
ISBN:9781119256830
Author:Amos Gilat
Publisher:John Wiley & Sons Inc
Probability and Statistics for Engineering and th...
Statistics
ISBN:9781305251809
Author:Jay L. Devore
Publisher:Cengage Learning
Statistics for The Behavioral Sciences (MindTap C...
Statistics
ISBN:9781305504912
Author:Frederick J Gravetter, Larry B. Wallnau
Publisher:Cengage Learning
Elementary Statistics: Picturing the World (7th E...
Statistics
ISBN:9780134683416
Author:Ron Larson, Betsy Farber
Publisher:PEARSON
The Basic Practice of Statistics
Statistics
ISBN:9781319042578
Author:David S. Moore, William I. Notz, Michael A. Fligner
Publisher:W. H. Freeman
Introduction to the Practice of Statistics
Statistics
ISBN:9781319013387
Author:David S. Moore, George P. McCabe, Bruce A. Craig
Publisher:W. H. Freeman