
ENGR.ECONOMIC ANALYSIS
14th Edition
ISBN: 9780190931919
Author: NEWNAN
Publisher: Oxford University Press
expand_more
expand_more
format_list_bulleted
Related questions
Question
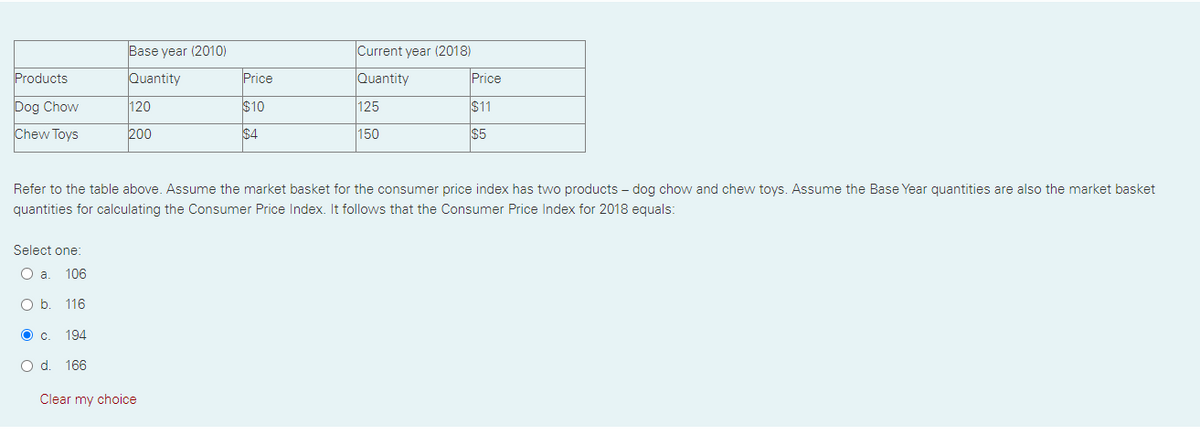

Transcribed Image Text:Base year (2010)
Current year (2018)
Products
Quantity
Price
Quantity
Price
Dog Chow
120
$10
125
$11
Chew Toys
200
$4
150
$5
Refer to the table above. Assume the market basket for the consumer price index has two products – dog chow and chew toys. Assume the Base Year quantities are also the market basket
quantities for calculating the Consumer Price Index. It follows that the Consumer Price Index for 2018 equals:
Select one:
106
Ob.
116
194
O d. 166
Clear my choice

Transcribed Image Text:Refer back to the previous problem. Suppose that between 2010 and 2018 your annual salary increased from $60,000 to S66,000. It follows that the economy experienced
and your real
income
(Note: If nominal income grow slower than CPI, real income decreases.)
Select one:
Oa.
inflation; increased
O b
deflation; decreased
inflation; decreased
O d. deflation; increased
Expert Solution
This question has been solved!
Explore an expertly crafted, step-by-step solution for a thorough understanding of key concepts.

This is a popular solution

Trending nowThis is a popular solution!

Step by stepSolved in 2 steps

Knowledge Booster

Similar questions
- b. Construct price index number using Laspeyre's Method Year 2015 Quantity 160 Year 2014 Quantity Price Commodity Price 20 Rice Sugar 100 28 11 18 30 37 Salt 1 1 12 Milk 8 57 32 149arrow_forwardNominal Average Hourly Eamings Year CPI (1982-1984 100) 1965 $265 32 2010 2259 219 The table above reports the nominal average hourly earnings in private industry and the consumer price index for 1965 and 2010. Refer to Table 20-14. The real average hourly eamings for 1965 in 2010 dollars equal Select one: a. $12.10. x b. $18.14. C. $5.80. d. $3.87.arrow_forwardThe economy of country Y produces 5 commodities; rice, salted fish, sugar, salt, and oil. The following table shows the outputs and prices for year 2000, 2001 and 2002. Instructions calculate Paasche consumer price index for 2001 and 2002 using 2000 as base year!arrow_forward
- number 12 pleasearrow_forwardQuestion 4 Between 2015 and 2016, the CPI of a small nation rose from 1.82 to 1.85. If household incomes rose by 3% during that period of time, which of the following is true? O The purchasing power of household income fell between 2015 and 2016. O The purchasing power of household income rose between 2015 and 2016. O The purchasing power of household income remained constant between 2015 and 2016. O The CPI cannot be used to determine how the purchasing power of household income changes over time.arrow_forwardConsumer price index, based on a problem from “Principles of Economics” byN. Gregory Mankiw Question 3) Wen is a typical consumer. Wen spent a total of $10 on 10 pomegranates, $36 on 3 shawarmas,and $35 on 7 cups of coffee in August. In September, Wen spent a total of $18 on 12 pomegranates, $24on 2 shawarmas, and $42 on 7 cups of coffee. In October, Wen spent a total of $22 on 11 pomegranates,$33 on 3 shawarmas, and $32 on 4 cups of coffee. a) Calculate the price of one unit of each good in each month.b) Using August as base month, calculate the CPI for each month.c) Find the inflation rate for September and October.arrow_forward
- 1arrow_forward21. Given the data in the above table, what is the price index for 2015, using 2012 as the base year and using the 2012 consumption pattern (market basket)? a) 125 b) 153 c) 1.2 d) 164 e) 120arrow_forwardUsing those figures, fill in the following table, making sure to round your responses to the nearest U.S. dollar.YearGolferNominal WinningsU.S. CPIWinnings in 2021 Dollars(Dollars)(1983 = 100)1945 Byron Nelson 63,336 18 1972 Jack Nicklaus 320,542 41.8 1982 Craig Stadler 446,462 96.5 2021 John Rahm 7,705,933 264.7 7,705,933arrow_forward
- Please answer correct calculation plz Don't answer by pen paper plzarrow_forward3. In a small community, breakfast is the most important meal of the day. Therefore, the only two goods that this community produces are coffee and scones in the following amounts: Year 2020 2021 Quantity 60 cups 90 cups Coffee Price $1.25 $1.45 Quantity 45 units 65 units Scones Price $2.10 $3.95 a) Calculate the inflation rate for 2021 using the GDP deflator method (assume that 2020 is the base year for real GDP calculations). Show your work. b) Calculate the inflation rate for 2021 using the CPI method (assume that 2020 is the base year for CPI calculations). Additionally, assume that the consumption basket for both years contains only 10 cups of coffee and 40 scones. Show your work. c) Compare the results of both inflation calculations and explain why they are similar or different based on the two methods and on the specific data used in this example.arrow_forwardQ28arrow_forward
arrow_back_ios
SEE MORE QUESTIONS
arrow_forward_ios
Recommended textbooks for you
 Principles of Economics (12th Edition)EconomicsISBN:9780134078779Author:Karl E. Case, Ray C. Fair, Sharon E. OsterPublisher:PEARSON
 Engineering Economy (17th Edition)EconomicsISBN:9780134870069Author:William G. Sullivan, Elin M. Wicks, C. Patrick KoellingPublisher:PEARSON
 Principles of Economics (MindTap Course List)EconomicsISBN:9781305585126Author:N. Gregory MankiwPublisher:Cengage Learning
 Managerial Economics: A Problem Solving ApproachEconomicsISBN:9781337106665Author:Luke M. Froeb, Brian T. McCann, Michael R. Ward, Mike ShorPublisher:Cengage Learning
 Managerial Economics & Business Strategy (Mcgraw-...EconomicsISBN:9781259290619Author:Michael Baye, Jeff PrincePublisher:McGraw-Hill Education
Principles of Economics (12th Edition)
Economics
ISBN:9780134078779
Author:Karl E. Case, Ray C. Fair, Sharon E. Oster
Publisher:PEARSON
Engineering Economy (17th Edition)
Economics
ISBN:9780134870069
Author:William G. Sullivan, Elin M. Wicks, C. Patrick Koelling
Publisher:PEARSON
Principles of Economics (MindTap Course List)
Economics
ISBN:9781305585126
Author:N. Gregory Mankiw
Publisher:Cengage Learning
Managerial Economics: A Problem Solving Approach
Economics
ISBN:9781337106665
Author:Luke M. Froeb, Brian T. McCann, Michael R. Ward, Mike Shor
Publisher:Cengage Learning
Managerial Economics & Business Strategy (Mcgraw-...
Economics
ISBN:9781259290619
Author:Michael Baye, Jeff Prince
Publisher:McGraw-Hill Education