
MATLAB: An Introduction with Applications
6th Edition
ISBN: 9781119256830
Author: Amos Gilat
Publisher: John Wiley & Sons Inc
expand_more
expand_more
format_list_bulleted
Related questions
Concept explainers
Question
thumb_up100%
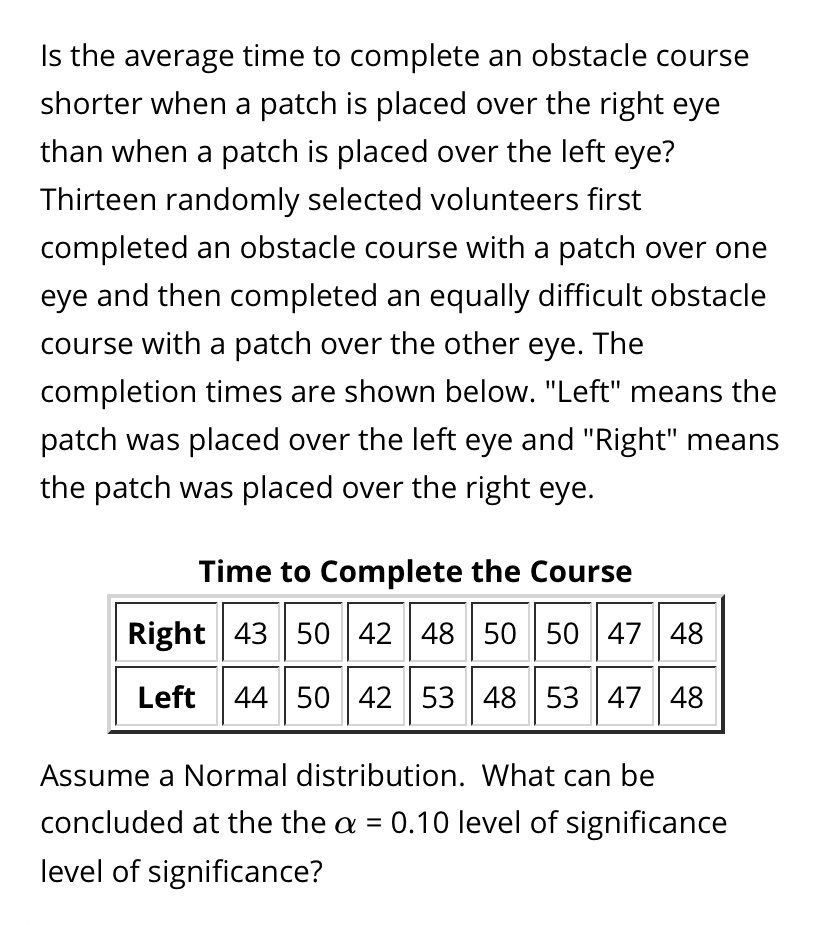

Transcribed Image Text:Is the average time to complete an obstacle course
shorter when a patch is placed over the right eye
than when a patch is placed over the left eye?
Thirteen randomly selected volunteers first
completed an obstacle course with a patch over one
eye and then completed an equally difficult obstacle
course with a patch over the other eye. The
completion times are shown below. "Left" means the
patch was placed over the left eye and "Right" means
the patch was placed over the right eye.
Time to Complete the Course
Right 43 50 42 48 50 50 47 48
Left
44 50 42 53 48 53 47 48
Assume a Normal distribution. What can be
concluded at the the a = 0.10 level of significance
level of significance?

Transcribed Image Text:b. The test statistic (t
|(please
show your answer to 3 decimal places.)
c. The p-value =
(Please show your
answer to 4 decimal places.)
Expert Solution
This question has been solved!
Explore an expertly crafted, step-by-step solution for a thorough understanding of key concepts.

Step by stepSolved in 3 steps with 2 images

Knowledge Booster


Learn more about
Need a deep-dive on the concept behind this application? Look no further. Learn more about this topic, statistics and related others by exploring similar questions and additional content below.Similar questions
- A raffle is being held to benefit the local animal shelter. They sell 671 tickets that do not win any prize, 9 tickets that win a free adoption (valued at $20), and one ticket that wins $165 worth of pet supplies and toys. If they are selling the tickets for $5 each, how much should the shelter expect to earn for each ticket sold?arrow_forwardThe first picture is the question and the second is the ones that I need help with. Thanksarrow_forwardDo men take less time than women to get out of bed in the morning? The 42 men observed averaged 7.6 minutes to get out of bed after the alarm rang. Their standard deviation was 2.2. The 52 women observed averaged 9 minutes and their standard deviation was 2.1 minutes. What can be concluded at the a = :0.01 %3D level of significance?arrow_forward
- For the data in the table, find the mean and the median of the monthly high temperatures. Then do the same for the monthly low temperatures. The mean of the high temperatures is ______F (type an integer or a decimal.) Month High low Jan 17 8 Feb 23 13 Mar 30 19 Temperatures are in degrees fahrenheit Apr 41 28 May 54 43arrow_forwarda researcher wants to determine the average amount of minutes it takes for the medicine to reduce the pain for adult males. The researcher contacted 107 subjects to participate in the study, n=but only got results from 79 of the subjects. The average time it took for the medicine to reduce headache pain of these subjects was 27 minutes. What is the population? What is the sample? What tis the parameter? What is the symbol for this parameter? What is the statistics? What is the symbol for this statistics?arrow_forwardPlease answer a-d. Thanks!arrow_forward
arrow_back_ios
SEE MORE QUESTIONS
arrow_forward_ios
Recommended textbooks for you
- MATLAB: An Introduction with ApplicationsStatisticsISBN:9781119256830Author:Amos GilatPublisher:John Wiley & Sons Inc
 Probability and Statistics for Engineering and th...StatisticsISBN:9781305251809Author:Jay L. DevorePublisher:Cengage Learning
 Statistics for The Behavioral Sciences (MindTap C...StatisticsISBN:9781305504912Author:Frederick J Gravetter, Larry B. WallnauPublisher:Cengage Learning
  Elementary Statistics: Picturing the World (7th E...StatisticsISBN:9780134683416Author:Ron Larson, Betsy FarberPublisher:PEARSON
 The Basic Practice of StatisticsStatisticsISBN:9781319042578Author:David S. Moore, William I. Notz, Michael A. FlignerPublisher:W. H. Freeman
 Introduction to the Practice of StatisticsStatisticsISBN:9781319013387Author:David S. Moore, George P. McCabe, Bruce A. CraigPublisher:W. H. Freeman
MATLAB: An Introduction with Applications
Statistics
ISBN:9781119256830
Author:Amos Gilat
Publisher:John Wiley & Sons Inc
Probability and Statistics for Engineering and th...
Statistics
ISBN:9781305251809
Author:Jay L. Devore
Publisher:Cengage Learning
Statistics for The Behavioral Sciences (MindTap C...
Statistics
ISBN:9781305504912
Author:Frederick J Gravetter, Larry B. Wallnau
Publisher:Cengage Learning
Elementary Statistics: Picturing the World (7th E...
Statistics
ISBN:9780134683416
Author:Ron Larson, Betsy Farber
Publisher:PEARSON
The Basic Practice of Statistics
Statistics
ISBN:9781319042578
Author:David S. Moore, William I. Notz, Michael A. Fligner
Publisher:W. H. Freeman
Introduction to the Practice of Statistics
Statistics
ISBN:9781319013387
Author:David S. Moore, George P. McCabe, Bruce A. Craig
Publisher:W. H. Freeman