
A First Course in Probability (10th Edition)
10th Edition
ISBN: 9780134753119
Author: Sheldon Ross
Publisher: PEARSON
expand_more
expand_more
format_list_bulleted
Related questions
Question
Please answer questions 5and 6. Thank you
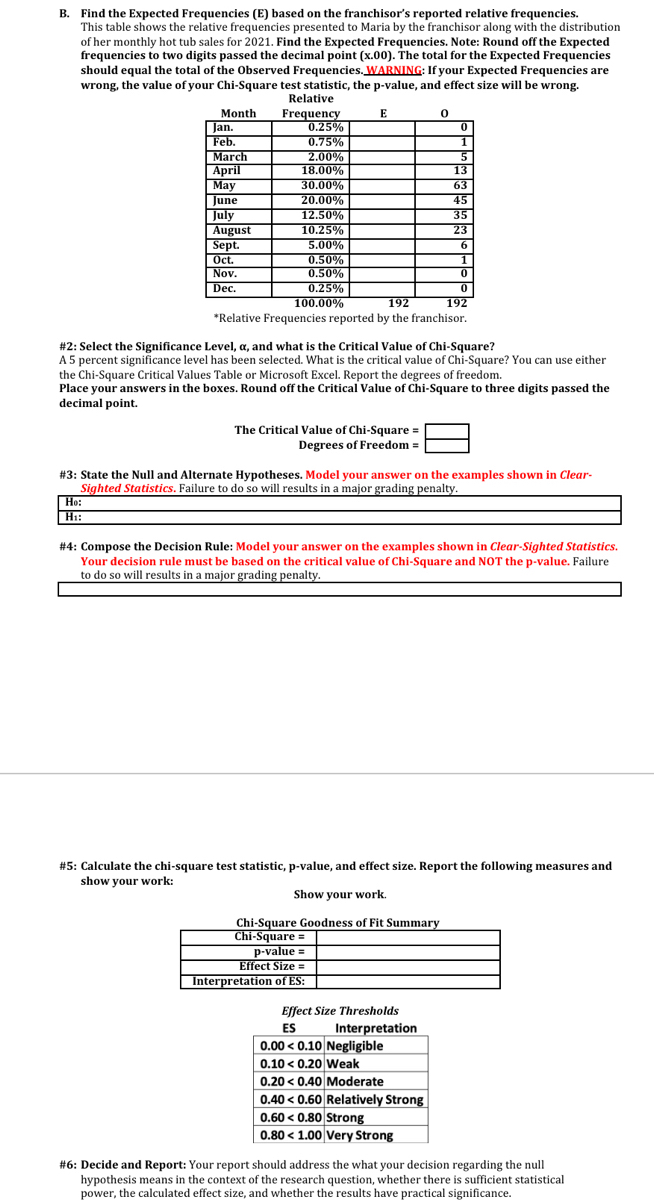

Transcribed Image Text:B. Find the Expected Frequencies (E) based on the franchisor's reported relative frequencies.
This table shows the relative frequencies presented to Maria by the franchisor along with the distribution
of her monthly hot tub sales for 2021. Find the Expected Frequencies. Note: Round off the Expected
frequencies to two digits passed the decimal point (x.00). The total for the Expected Frequencies
should equal the total of the Observed Frequencies. WARNING: If your Expected Frequencies are
wrong, the value of your Chi-Square test statistic, the p-value, and effect size will be wrong.
Relative
Month
Jan.
Feb.
March
April
May
June
July
August
Sept.
Oct.
Frequency
0.25%
0.75%
2.00%
18.00%
30.00%
20.00%
12.50%
13
63
45
35
10.25%
23
5.00%
0.50%
1
Nov.
0.50%
Dec.
0.25%
100.00%
192
192
*Relative Frequencies reported by the franchisor.
#2: Select the Significance Level, a, and what is the Critical Value of Chi-Square?
A 5 percent significance level has been selected. What is the critical value of Chi-Square? You can use either
the Chi-Square Critical Values Table or Microsoft Excel. Report the degrees of freedom.
Place your answers in the boxes. Round off the Critical Value of Chi-Square to three digits passed the
decimal point.
The Critical Value of Chi-Square =
Degrees of Freedom =
# 3: State the Null and Alternate Hypotheses. Model your answer on the examples shown in Clear-
Sighted Statistics. Failure to do so will results in a major grading penalty.
Ho:
Hi:
# 4: Compose the Decision Rule: Model your answer on the examples shown in Clear-Sighted Statistics.
Your decision rule must be based on the critical value of Chi-Square and NOT the p-value. Failure
to do so will results in a major grading penalty.
#5: Calculate the chi-square test statistic, p-value, and effect size. Report the following measures and
show your work:
Show your work.
Chi-Square Goodness of Fit Summary
Chi-Square =
p-value =
Effect Size =
Interpretation of ES:
Effect Size Thresholds
Interpretation
0.00 < 0.10 Negligible
ES
0.10 < 0.20 weak
0.20 < 0.40 Moderate
0.40 < 0.60 Relatively Strong
0.60 < 0.80 Strong
0.80 < 1.00 very Strong
#6: Decide and Report: Your report should address the what your decision regarding the null
hypothesis means in the context of the research question, whether there is sufficient statistical
power, the calculated effect size, and whether the results have practical significance.
Expert Solution
This question has been solved!
Explore an expertly crafted, step-by-step solution for a thorough understanding of key concepts.

This is a popular solution

Trending nowThis is a popular solution!

Step by stepSolved in 3 steps with 3 images

Knowledge Booster

Similar questions
- there are 14 coins in your pocket that are either quarters or nickles. they total 2.50$. how many of each type of coin do you have?arrow_forwardEmerson pays 227.25 for 3 windows. How many will Emerson pay for 5 windowsarrow_forwarda bakery receives an order for 1,600 cookies. if 12 cookies are packed in each bag, will 132 bags bags be enougharrow_forward
- How many does 5 apple and 4 orange together ?arrow_forwardplease can you now answer 3 and 4arrow_forwardJake is a train conductor. Every day he rides 20 miles to Jonesboro, 17.5 miles to Carver City, and 76.3 miles to Clinton. He then travels the same route back home. How many miles does he travel each day?arrow_forward
arrow_back_ios
arrow_forward_ios
Recommended textbooks for you
- A First Course in Probability (10th Edition)ProbabilityISBN:9780134753119Author:Sheldon RossPublisher:PEARSON

A First Course in Probability (10th Edition)
Probability
ISBN:9780134753119
Author:Sheldon Ross
Publisher:PEARSON