MATLAB: An Introduction with Applications
6th Edition
ISBN: 9781119256830
Author: Amos Gilat
Publisher: John Wiley & Sons Inc
expand_more
expand_more
format_list_bulleted
Question

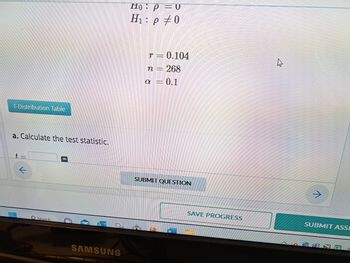
Transcribed Image Text:1-Distribution Table
a. Calculate the test statistic.
t-
Search
SAMSUNG
Ho: p = 0
H₁:p #0
r = 0.104
n = 268
a = 0.1
SUBMIT QUESTION
W
SAVE PROGRESS
SUBMIT ASSE

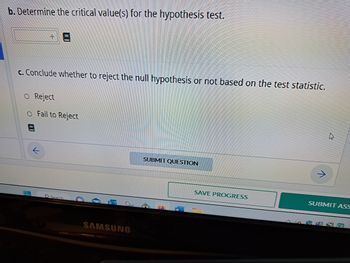
Transcribed Image Text:b. Determine the critical value(s) for the hypothesis test.
c. Conclude whether to reject the null hypothesis or not based on the test statistic.
O Reject
O Fail to Reject
8
L
Search
SAMSUNG
SUBMIT QUESTION
W
SAVE PROGRESS
AWA
→
SUBMIT ASS
Expert Solution
This question has been solved!
Explore an expertly crafted, step-by-step solution for a thorough understanding of key concepts.
Step by stepSolved in 2 steps with 2 images

Knowledge Booster
Similar questions
- Hi please answerarrow_forwardin this excerise we ar conducting many hypothesis tests to test a clai. assume that the null hypothesis is true. if 1100 tests are conducted using a signifance level of 5. approxmately how many of the test will incorrectly signifincancearrow_forwardA legal researcher was interrested in gender differences in the willingness of prosecutrs to plea bargain. She recorded the number of times they plea bargained out of their last 10 cases for a sample of eight female prosecutors and seven male prosecutors. Table 2 shows the number of plea bargain cases by gender. Females Males 9 4 3 5 5 7 9 4 9 3 5 4 7 3 5 From performing a hypothesis test to determine if female and male prosecutors differ in their plea bargaining of cases what is the p value?arrow_forward
- 2. Forty-five percent of the entering CSUN freshmen in Fall 2019 were proficient in math. www.csun.edu/counts/new_first_time_freshman.php a. You want to see if the percentage is different for this fall's entering freshmen. Your hypotheses are Ho: На: where p stands for the percentage of freshmen who were proficient in Fall 2019 / this fall. b. Suppose that the null hypothesis is true that the percentage is 45% for this fall. Here is the sampling distribution of the values of p that would be expected if you repeatedly took random samples of 150 freshman entering this fall and found the proportion proficient in math. From the sketch alone, estimate the mean and the SE 0.33 0.37 0.41 0.45 0.49 0.53 0.57 If the null hypothesis is true, would it be unusual to get 50% in your sample who were proficient in mathematics? Explain: If the null hypothesis is true, would it be unusual to get 45 freshmen in your sample who were proficient in mathematics? Explain: c. You take a random sample of 150…arrow_forwardif H0: u1=u2 and H1: u1=/= u2. then is it a right tail test or left?arrow_forwardFind the P-value with z-score (1) if doing a right-tail hypothesis testarrow_forward
- Traditionally in hypothesis testing, the null hypothesis represents the "status quo" which will be overturned only if there is evidence against it. Which of the statements below might represent a null hypothesis? dlo O Increased benefit offerings improved the quality of job candidates. O The defendant is not guilty. O The defendant is guilty. Continue Submit Assignment © 2022 McGraw Hill LLC. All Rights Reserved. Terms of Use | Privacy Center| Accessibility MacBook Air 80 888 DII DD F2 F3 F4 F5 F7 F9 F10 %23 & 3 4 5 6 9 * 00arrow_forwardA recent study at a university showed that the proportion of students who commute more than 15 miles to school is 25%. Suppose we have good reason to suspect that the proportion is greater than 25%, and we carry out a hypothesis test. State the null hypothesis H, and the alternative hypothesis H, that we would use for this test. Ho: 0 H;: D Oarrow_forwardwhat is the correct choicearrow_forward
arrow_back_ios
arrow_forward_ios
Recommended textbooks for you
 MATLAB: An Introduction with ApplicationsStatisticsISBN:9781119256830Author:Amos GilatPublisher:John Wiley & Sons Inc
 Probability and Statistics for Engineering and th...StatisticsISBN:9781305251809Author:Jay L. DevorePublisher:Cengage Learning
 Statistics for The Behavioral Sciences (MindTap C...StatisticsISBN:9781305504912Author:Frederick J Gravetter, Larry B. WallnauPublisher:Cengage Learning
 Elementary Statistics: Picturing the World (7th E...StatisticsISBN:9780134683416Author:Ron Larson, Betsy FarberPublisher:PEARSON
 The Basic Practice of StatisticsStatisticsISBN:9781319042578Author:David S. Moore, William I. Notz, Michael A. FlignerPublisher:W. H. Freeman
 Introduction to the Practice of StatisticsStatisticsISBN:9781319013387Author:David S. Moore, George P. McCabe, Bruce A. CraigPublisher:W. H. Freeman

MATLAB: An Introduction with Applications
Statistics
ISBN:9781119256830
Author:Amos Gilat
Publisher:John Wiley & Sons Inc

Probability and Statistics for Engineering and th...
Statistics
ISBN:9781305251809
Author:Jay L. Devore
Publisher:Cengage Learning

Statistics for The Behavioral Sciences (MindTap C...
Statistics
ISBN:9781305504912
Author:Frederick J Gravetter, Larry B. Wallnau
Publisher:Cengage Learning

Elementary Statistics: Picturing the World (7th E...
Statistics
ISBN:9780134683416
Author:Ron Larson, Betsy Farber
Publisher:PEARSON

The Basic Practice of Statistics
Statistics
ISBN:9781319042578
Author:David S. Moore, William I. Notz, Michael A. Fligner
Publisher:W. H. Freeman

Introduction to the Practice of Statistics
Statistics
ISBN:9781319013387
Author:David S. Moore, George P. McCabe, Bruce A. Craig
Publisher:W. H. Freeman