
MATLAB: An Introduction with Applications
6th Edition
ISBN: 9781119256830
Author: Amos Gilat
Publisher: John Wiley & Sons Inc
expand_more
expand_more
format_list_bulleted
Related questions
Question
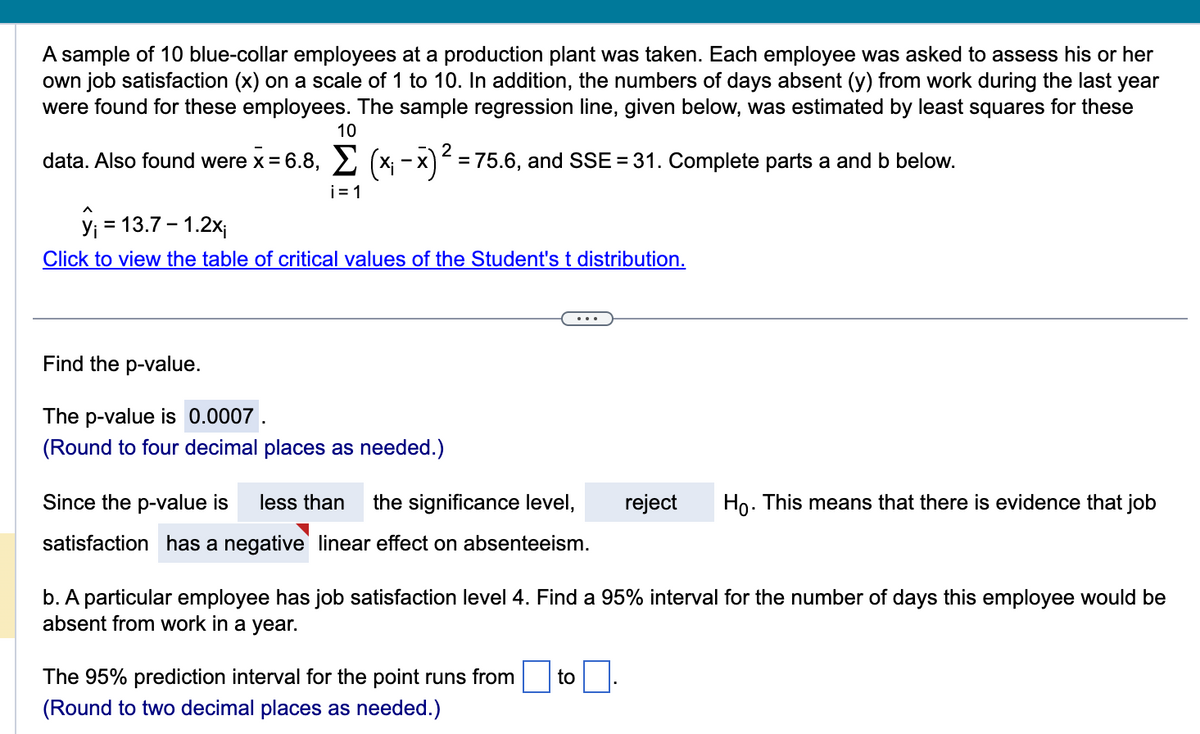

Transcribed Image Text:A sample of 10 blue-collar employees at a production plant was taken. Each employee was asked to assess his or her
own job satisfaction (x) on a scale of 1 to 10. In addition, the numbers of days absent (y) from work during the last year
were found for these employees. The sample regression line, given below, was estimated by least squares for these
10
2
data. Also found were x = 6.8, Σ (x₁ - x)² = 75.6, and SSE = 31. Complete parts a and b below.
i=1
y₁ = 13.7 - 1.2x₁
Click to view the table of critical values of the Student's t distribution.
Find the p-value.
The p-value is 0.0007.
(Round to four decimal places as needed.)
Since the p-value is less than the significance level,
satisfaction has a negative linear effect on absenteeism.
reject
The 95% prediction interval for the point runs from to
(Round to two decimal places as needed.)
Ho. This means that there is evidence that job
b. A particular employee has job satisfaction level 4. Find a 95% interval for the number of days this employee would be
absent from work in a year.
Expert Solution
This question has been solved!
Explore an expertly crafted, step-by-step solution for a thorough understanding of key concepts.

Step by stepSolved in 2 steps

Knowledge Booster

Similar questions
- Tiffany is a manager who needs to fire the worst performing 3% of employees. At her organization, employee performance is a normally distributed variable. Tiffany should fire employees who have a performance score that correspond with a z-score less than or equal to _____arrow_forwardJeff took 15 quizzes in his Calculus class. His quiz scores had the following 5 number summary. Based on this 5 number summary, are any of his quiz scores potentially an outlier? Min = 4 Q1 = 8 Median = 8.5 Q3 = 9 Max = 10arrow_forwardSuppose the observational units in a study are the patients arriving at an emergency room on a given day, 11 Nov 2019. For the following indicate whether it can legitimately be considered a variable or not: Whether or not men have to wait longer than women yes noarrow_forward
- For the following line graph, State at least one type of conclusion that could be made from the data provided for the KPI. Suggest one other data source that would provide more information to make data-driven decisions. Explain what information that source would supply. I used the line graph btw. Examples: 1)The KPI webpage for South Texas College provides information on the proportion of graduates who find employment. According to the data, over the past five years, the proportion of graduates who find work has risen annually. Data on the percentage of students who are employed in their field of study after graduation, the percentage of students who are employed full-time after graduation, and the percentage of students who are satisfied with their job after graduation would also be useful in making decisions about post-graduation success. This information would shed light on the factors that are causing the rise in the proportion of graduates who find employment. 2)The…arrow_forwardFor some data, we know the range R of the data is 12 and its median is 6. Find Estimated Lowest Number, and Estimated Highest Number for this data. Give you answers in the same order asked.arrow_forwardPlease helparrow_forward
- Complete the following statements. In general, set lie at or below the median. % of the values in a data set lie at or % of the values in a data below the first quartile (Q1). If a sample consists of 1700 test scores, of them would be at or below the second quartile (Q2). If a sample consists of 1700 test scores, of them would be at or above the third quartile (Q3).arrow_forwardIn a data set with 25 scores, if the value 16 occurs 12 times, what is its relative frequency?arrow_forward
arrow_back_ios
arrow_forward_ios
Recommended textbooks for you
- MATLAB: An Introduction with ApplicationsStatisticsISBN:9781119256830Author:Amos GilatPublisher:John Wiley & Sons Inc
 Probability and Statistics for Engineering and th...StatisticsISBN:9781305251809Author:Jay L. DevorePublisher:Cengage Learning
 Statistics for The Behavioral Sciences (MindTap C...StatisticsISBN:9781305504912Author:Frederick J Gravetter, Larry B. WallnauPublisher:Cengage Learning
  Elementary Statistics: Picturing the World (7th E...StatisticsISBN:9780134683416Author:Ron Larson, Betsy FarberPublisher:PEARSON
 The Basic Practice of StatisticsStatisticsISBN:9781319042578Author:David S. Moore, William I. Notz, Michael A. FlignerPublisher:W. H. Freeman
 Introduction to the Practice of StatisticsStatisticsISBN:9781319013387Author:David S. Moore, George P. McCabe, Bruce A. CraigPublisher:W. H. Freeman
MATLAB: An Introduction with Applications
Statistics
ISBN:9781119256830
Author:Amos Gilat
Publisher:John Wiley & Sons Inc
Probability and Statistics for Engineering and th...
Statistics
ISBN:9781305251809
Author:Jay L. Devore
Publisher:Cengage Learning
Statistics for The Behavioral Sciences (MindTap C...
Statistics
ISBN:9781305504912
Author:Frederick J Gravetter, Larry B. Wallnau
Publisher:Cengage Learning
Elementary Statistics: Picturing the World (7th E...
Statistics
ISBN:9780134683416
Author:Ron Larson, Betsy Farber
Publisher:PEARSON
The Basic Practice of Statistics
Statistics
ISBN:9781319042578
Author:David S. Moore, William I. Notz, Michael A. Fligner
Publisher:W. H. Freeman
Introduction to the Practice of Statistics
Statistics
ISBN:9781319013387
Author:David S. Moore, George P. McCabe, Bruce A. Craig
Publisher:W. H. Freeman