
MATLAB: An Introduction with Applications
6th Edition
ISBN: 9781119256830
Author: Amos Gilat
Publisher: John Wiley & Sons Inc
expand_more
expand_more
format_list_bulleted
Related questions
Question
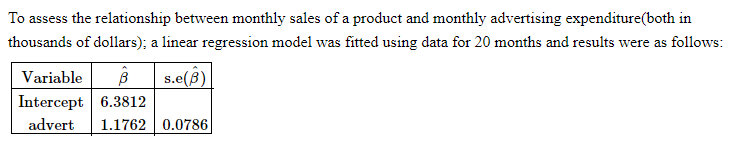

Transcribed Image Text:To assess the relationship between monthly sales of a product and monthly advertising expenditure(both in
thousands of dollars); a linear regression model was fitted using data for 20 months and results were as follows:
Variable B s.e(B)
Intercept 6.3812
advert 1.1762 0.0786

Transcribed Image Text:(b) Using critical value of 2.101, the 95% confidence interval for the slope parameter is(round off answers to two
decimal points):
lower confidence interval
upper confidence interval
Expert Solution
This question has been solved!
Explore an expertly crafted, step-by-step solution for a thorough understanding of key concepts.

Step by stepSolved in 2 steps with 2 images

Knowledge Booster

Similar questions
- Find the confidence intervalarrow_forwardWhat price do farmers get for their watermelon crops? In the third week of July, a random sample of 40 farming regions gave a sample mean of x = Assume that o is known to be $1.92 per 100 pounds. $6.88 per 100 pounds of watermelon. (a) Find a 90% confidence interval for the population mean price (per 100 pounds) that farmers in this region get for their watermelon crop (in dollars). What is the margin of error (in dollars)? (For each answer, enter a number. Round your answers to two decimal places.) lower limit $ upper limit 2$ margin of error $ (b) Find the sample size necessary for a 90% confidence level with maximal error of estimate E = 0.27 for the mean price per 100 pounds of watermelon. (Enter a number. Round up to the nearest whole number.) farming regions (c) A farm brings 15 tons of watermelon to market. Find a 90% confidence interval for the population mean cash value of this crop (in dollars). What is the margin of error (in dollars)? Hint: 1 ton is 2000 pounds. (For each…arrow_forwardWhat price do farmers get for their watermelon crops? In the third week of July, a random sample of 42 farming regions gave a sample mean of = $6.88 per 100 pounds of watermelon. Assume that σ is known to be $1.94 per 100 pounds. (a) Find a 90% confidence interval for the population mean price (per 100 pounds) that farmers in this region get for their watermelon crop (in dollars). What is the margin of error (in dollars)? (For each answer, enter a number. Round your answers to two decimal places.)lower limit $ upper limit $ margin of error $ (b) Find the sample size necessary for a 90% confidence level with maximal error of estimate E = 0.33 for the mean price per 100 pounds of watermelon. (Enter a number. Round up to the nearest whole number.)farming regions (c) A farm brings 15 tons of watermelon to market. Find a 90% confidence interval for the population mean cash value of this crop (in dollars). What is the margin of error (in dollars)? Hint: 1 ton is 2000 pounds.…arrow_forward
- What is the formula for CONFIDENCE INTERVAL (CI) FOR μ1 – μ2 (TWO INDEPENDENT SAMPLES)?arrow_forwardWhat price do farmers get for their watermelon crops? In the third week of July, a random sample of 40 farming regions gave a sample mean of = $6.88 per 100 pounds of watermelon. Assume that σ is known to be $1.92 per 100 pounds. (a) Find a 90% confidence interval for the population mean price (per 100 pounds) that farmers in this region get for their watermelon crop (in dollars). What is the margin of error (in dollars)? (For each answer, enter a number. Round your answers to two decimal places.)lower limit $ upper limit $ margin of error $ (b) Find the sample size necessary for a 90% confidence level with maximal error of estimate E = 0.25 for the mean price per 100 pounds of watermelon. (Enter a number. Round up to the nearest whole number.) farming regions (c) A farm brings 15 tons of watermelon to market. Find a 90% confidence interval for the population mean cash value of this crop (in dollars). What is the margin of error (in dollars)? Hint: 1 ton is 2000…arrow_forwardWhat price do farmers get for their watermelon crops? In the third week of July, a random sample of 45 farming regions gave a sample mean of = $6.88 per 100 pounds of watermelon. Assume that σ is known to be $1.98 per 100 pounds. (a) Find a 90% confidence interval for the population mean price (per 100 pounds) that farmers in this region get for their watermelon crop (in dollars). What is the margin of error (in dollars)? (For each answer, enter a number. Round your answers to two decimal places.)lower limit $ upper limit $ margin of error $ (b) Find the sample size necessary for a 90% confidence level with maximal error of estimate E = 0.45 for the mean price per 100 pounds of watermelon. (Enter a number. Round up to the nearest whole number.) farming regions (c) A farm brings 15 tons of watermelon to market. Find a 90% confidence interval for the population mean cash value of this crop (in dollars). What is the margin of error (in dollars)? Hint: 1 ton is 2000…arrow_forward
- What price do farmers get for their watermelon crops? In the third week of July, a random sample of 44 farming regions gave a sample mean of = $6.88 per 100 pounds of watermelon. Assume that σ is known to be $1.90 per 100 pounds. (a) Find a 90% confidence interval for the population mean price (per 100 pounds) that farmers in this region get for their watermelon crop (in dollars). What is the margin of error (in dollars)? (For each answer, enter a number. Round your answers to two decimal places.) lower limit $ _______upper limit $ ______margin of error $ ______ (b) Find the sample size necessary for a 90% confidence level with maximal error of estimate E = 0.25 for the mean price per 100 pounds of watermelon. (Enter a number. Round up to the nearest whole number.) ________ farming regions (c) A farm brings 15 tons of watermelon to market. Find a 90% confidence interval for the population mean cash value of this crop (in dollars). What is the margin of error (in dollars)?…arrow_forwardWhat price do farmers get for their watermelon crops? In the third week of July, a random sample of 40 farming regions gave a sample mean of = $6.88 per 100 pounds of watermelon. Assume that σ is known to be $1.90 per 100 pounds. (a) Find a 90% confidence interval for the population mean price (per 100 pounds) that farmers in this region get for their watermelon crop (in dollars). What is the margin of error (in dollars)? (For each answer, enter a number. Round your answers to two decimal places.)lower limit $ upper limit $ margin of error $ (b) Find the sample size necessary for a 90% confidence level with maximal error of estimate E = 0.37 for the mean price per 100 pounds of watermelon. (Enter a number. Round up to the nearest whole number.) farming regions (c) A farm brings 15 tons of watermelon to market. Find a 90% confidence interval for the population mean cash value of this crop (in dollars). What is the margin of error (in dollars)? Hint: 1 ton is 2000…arrow_forwardAn SRS of 450 high school seniors gained an average of ?¯=20 points in their second attempt at the SAT Mathematics exam. Assume that the change in score has a Normal distribution with standard deviation ?=49 . (a) Find a 95% confidence interval for the mean change in score ? in the population of all high school seniors. (Enter your answers rounded to two decimal places.) lower bound of confidence interval: upper bound of confidence interval: (b) What is the margin of error for 95% ? (Enter your answer rounded to two decimal places.) margin of error: (c) Suppose we had an SRS of just 100 high school seniors. What would be the margin of error for 95% confidence? (Enter your answer rounded to three decimal places.) margin of error:arrow_forward
arrow_back_ios
arrow_forward_ios
Recommended textbooks for you
- MATLAB: An Introduction with ApplicationsStatisticsISBN:9781119256830Author:Amos GilatPublisher:John Wiley & Sons Inc
 Probability and Statistics for Engineering and th...StatisticsISBN:9781305251809Author:Jay L. DevorePublisher:Cengage Learning
 Statistics for The Behavioral Sciences (MindTap C...StatisticsISBN:9781305504912Author:Frederick J Gravetter, Larry B. WallnauPublisher:Cengage Learning
  Elementary Statistics: Picturing the World (7th E...StatisticsISBN:9780134683416Author:Ron Larson, Betsy FarberPublisher:PEARSON
 The Basic Practice of StatisticsStatisticsISBN:9781319042578Author:David S. Moore, William I. Notz, Michael A. FlignerPublisher:W. H. Freeman
 Introduction to the Practice of StatisticsStatisticsISBN:9781319013387Author:David S. Moore, George P. McCabe, Bruce A. CraigPublisher:W. H. Freeman
MATLAB: An Introduction with Applications
Statistics
ISBN:9781119256830
Author:Amos Gilat
Publisher:John Wiley & Sons Inc
Probability and Statistics for Engineering and th...
Statistics
ISBN:9781305251809
Author:Jay L. Devore
Publisher:Cengage Learning
Statistics for The Behavioral Sciences (MindTap C...
Statistics
ISBN:9781305504912
Author:Frederick J Gravetter, Larry B. Wallnau
Publisher:Cengage Learning
Elementary Statistics: Picturing the World (7th E...
Statistics
ISBN:9780134683416
Author:Ron Larson, Betsy Farber
Publisher:PEARSON
The Basic Practice of Statistics
Statistics
ISBN:9781319042578
Author:David S. Moore, William I. Notz, Michael A. Fligner
Publisher:W. H. Freeman
Introduction to the Practice of Statistics
Statistics
ISBN:9781319013387
Author:David S. Moore, George P. McCabe, Bruce A. Craig
Publisher:W. H. Freeman