
MATLAB: An Introduction with Applications
6th Edition
ISBN: 9781119256830
Author: Amos Gilat
Publisher: John Wiley & Sons Inc
expand_more
expand_more
format_list_bulleted
Related questions
Question
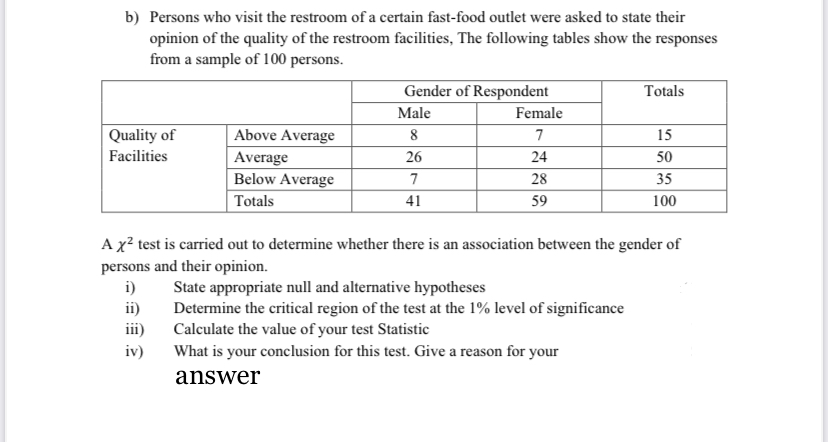

Transcribed Image Text:b) Persons who visit the restroom of a certain fast-food outlet were asked to state their
opinion of the quality of the restroom facilities, The following tables show the responses
from a sample of 100 persons.
Quality of
Facilities
Above Average
Average
Below Average
Totals
iv)
Gender of Respondent
Male
8
26
7
41
Female
7
24
28
59
Totals
15
50
35
100
A x² test is carried out to determine whether there is an association between the gender of
persons and their opinion.
i)
State appropriate null and alternative hypotheses
ii)
Determine the critical region of the test at the 1% level of significance
Calculate the value of your test Statistic
iii)
What is your conclusion for this test. Give a reason for your
answer
Expert Solution
This question has been solved!
Explore an expertly crafted, step-by-step solution for a thorough understanding of key concepts.

Step by stepSolved in 5 steps with 1 images

Follow-up Questions
Read through expert solutions to related follow-up questions below.
Follow-up Question
Question i. asked to state the appropriate null hypothesis and alternative hypothesis. The answer given are the definitions. Are these the answers? Can this question be revised?
Solution
by Bartleby Expert
Follow-up Question
For step 3, the 2nd answer, what does Dof stands for?
Is the excel
Solution
by Bartleby Expert
Knowledge Booster

Similar questions
- A study was conducted to determine the proportion of people who dream in black and white instead of color. Among 303 people over the age of 55, 79 dream in black and white, and among 284 people, under the age of 25, people over 55 who dream in black and white is greater than the proportion for those under 25. Complete parts (a) through (c) below. dream in black and white. Use a 0.05 significance level to test the claim that the proportion of vvnat is tne conciusion pasea on tne contiaence intervai? Because the confidence interval limits V 0, it appears that the two proportions are Because the confidence interval limits include values, it appears that the proportion of people over 55 who dream in black and white is V the proportion for those under 25. c. An explanation for the results is that those over the age of 55 grew up exposed to media that was displayed in black and white. Can these results be used to verify that explanation? O A. Yes. The results can be used to verify the given…arrow_forward3. What is the sample mean for the following sample of scores? Scores: 1, 2, 5, 4arrow_forwardPlease scroll down to see the entire question. The quality control manager of an automobile parts factory would like to know whether there is a difference between the proportion of defective parts produced on different days of the work week. Random samples of 100 parts produced on each day of the week were selected, with the following results: Result: Mon Tues Wed Thurs Fri # of defective parts: 12 7 7 10 14 # of non-defective parts: 88 93 93 90 86 At 5% level of significance, is there evidence of a significant difference in the proportion of defective parts produced on the various days of the week (A ) Step-1: State the hypotheses ( H0 and H1 ), and identify the claim A. H0: Proportion of defective parts is not the same for the days of the week. H1: Proportion of defective parts is the same for all days of the week B. H0: Proportion of defective parts is dependent on the days of the week H1: Proportionof defective parts is…arrow_forward
- Astudy was conducted to determine the proportion of people who dream in black and white instead of color. Among 317 people over the age of 55, 63 dream in black and white, and among 300 people under the age of 25, 17 dream in black and white. Use a 0.01 significance level to test the claim that the proportion of people over 55 who dreamn tackand white is greater than the proportion for those under 25. Complete parts (a) through (c) below. a. Test the claim using a hypothesis test. Consider the first sample to be the sample of people over the age of 55 and the second sample to be the sample of people under the age of 25. What are the null and altenative hypotheses for the hypothesis test? OA. Ho P =P2 H, P P2 O B. Ho P1 SP2 H,: P, #P2 O C. Ho P1 #P2 H, P, = P2 O D. H, P1 =P2 H P P2 O E. H, P1 =P2 H,: P,arrow_forwardA study was conducted to determine the proportion of people who dream in black and white instead of color. Among 303 people over the age of 55, 79 dream in black and white, and among 300 people under the age of 25, 18 dream in black and white. Use a 0.01 significance level to test the claim that the proportion of people over 55 who dream in black and white is greater than the proportion for those under 25. Complete parts (a) through (c) below. a. Test the claim using a hypothesis test. Consider the first sample to be the sample of people over the age of 55 and the second sample to be the sample of people under the age of 25. What are the null and alternative hypotheses for the hypothesis test? O A. Ho: P₁ = P₂ H₁: P₁ P2 O D. Ho: P₁ #P₂ H₁: P₁ = P2 Identify the test statistic. z=0 Z= (Round to two decimal places as needed.) Identify the P-value. P-value= (Round to three decimal places as needed.) What is the conclusion based on the hypothesis test? the significance level of a = 0.01, so…arrow_forwardA certain company will purchase the house of any employee who is transferred out of state and will handle all details of reselling the house. The purchase price is based on two assessments, one assessor being chosen by the employee and one by the company. Based on the sample of eight assessments shown, do the two assessors agree? Use the .01 level of significance. Assessments of Eight Homes ($ thousands) Assessed by Home 1 Home 2 Home 3 Home 4 Home 5 Home 6 Home 7 Home 8 Company 330 345 452 270 298 286 537 744 Employee 317 350 473 280 307 283 523 769 Click here for the Excel Data File (a) Choose the appropriate hypotheses. Assume d = company assessed value – employee assessed value. multiple choice 1 H0: μd = 0 versus H1: μd ≠ 0. H0: μd ≠ 0 versus H1: μd = 0. (b) State the decision rule for .01 level of significance. (Round your answers to 2 decimal places. A negative value should be indicated by a minus sign.) Reject the null hypothesis if tcalc < or…arrow_forwardA study was conducted to determine the proportion of people who dream in black and white instead of color. Among 318 people over the age of 55, 77 dream in black and white, and among 298 people under the age of 25, 16 dream in black and white. Use a 0.05 significance level to test the claim that the proportion of people over 55 who dream in black and white is greater than the proportion for those under 25. Complete parts (a) through (c) below. H4: P1 P2 H: P1 #P2 O D. Ho: P1 SP2 H1: P1#P2 O E. Ho: P1 P2 H1: P1 = P2 O F. Ho: P1 =P2 H1: P1 #P2 Identify the test statistic. z= 6.52 (Round to two decimal places as needed.) Identify the P-value. P-value = 0.000 (Round to three decimal places as needed.) What is the conclusion based on the hypothesis test? The P-value is less than the significance level of a = 0.05, so reject the null hypothesis. There is sufficient evidence to support the claim that the proportion of people over 55 who dream in black and white is greater than the proportion…arrow_forwardA study was conducted to determine the proportion of people who dream in black and white instead of color. Among 320 people over the age of 55, 72 dream in black and white, and among 313 people under the age of 25, 15 dream in black and white. Use a 0.01 significance level to test the claim that the proportion of people over 55 who dream in black and white is greater than the proportion for those under 25. Complete parts (a) through (c) below. a. Test the claim using a hypothesis test. Consider the first sample to be the sample of people over the age of 55 and the second sample to be the sample of people under the age of 25. What are the null and alternative hypotheses for the hypothesis test? A. H0: p1=p2 H1: p1≠p2 B. H0: p1=p2 H1: p1>p2 C. H0: p1≥p2 H1: p1≠p2 D. H0: p1≠p2 H1: p1=p2 E. H0: p1≤p2 H1: p1≠p2 F. H0: p1=p2 H1:p1<p2 Identify the test statistic. z=_____ (Round to…arrow_forwardA random sample of employees participating in a company fitness program were asked how many days they logged an exercise activity in the past month. Their responses are reported in the histogram below.Based on the histogram above, what is the class width? Clas width = ? Days What is the sample size? Sample size = ? employeesarrow_forwardA study was conducted to determine the proportion of people who dream in black and white instead of color. Among 295 people over the age of 55, 64 dream in black and white, and among 312 people under the age of 25, 13 dream in black and white. Use a 0.05 significance level to test the claim that the proportion of people over 55 who dream in black and white is greater than the proportion for those under 25. Complete parts (a) through (c) below. a. Test the claim using a hypothesis test. Consider the first sample to be the sample of people over the age of 55 and the second sample to be the sample of people under the age of 25. What are the null and alternative hypotheses for the hypothesis test? O A. Ho: P₁ = P₂ H₁: P₁ P2 O B. Ho: P₁ P₂ H₁: P₁ = P2 O E. Ho: P₁ SP₂ H₁: P₁ P2 OC. Ho: P₁ P2 H₁: P₁ P2 OF. Ho: P₁ H₁: P₁ P₂ P2arrow_forwardA study was conducted to determine the proportion of people who dream in black and white instead of color. Among 294 people over the age of 55, 63 dream in black and white, and among 300 people under the age of 25, 19 dream in black and white. Use a 0.05 significance level to test the claim that the proportion of people over 55 who dream in black and white is greater than the proportion for those under 25. Complete parts (a) through (c) below. a. Test the claim using a hypothesis test. Consider the first sample to be the sample of people over the age of 55 and the second sample to be the sample of people under the age of 25. What are the null and alternative hypotheses for the hypothesis test? A. Ho: P₁ = P2 H₁: P₁ P2 D. Ho: P₁ P2 H₁: P₁ P2 OB. Ho: P1 P2 H₁: P₁ P2 O E. Ho: P1 H₁: P₁ P2 P2 O C. Ho: P₁ P2 H₁: P₁ = P2 OF. Ho: P₁ P2 H₁: P₁ P2arrow_forwardA study was conducted to determine the proportion of people who dream in black and white instead of color. Among 323 people over the age of 55, 71 dream in black and white, and among 288 people under the age of 25, 14 dream in black and white. Use a 0.05 significance level to test the claim that the proportion of people over 55 who dream in black and white is greater than the proportion for those under 25. Complete parts (a) through (c) below. Question content area bottom Part 1 a. Test the claim using a hypothesis test. Consider the first sample to be the sample of people over the age of 55 and the second sample to be the sample of people under the age of 25. What are the null and alternative hypotheses for the hypothesis test? A. H0: p1=p2 H1: p1<p2 B. H0: p1≥p2 H1: p1≠p2 C. H0: p1≠p2 H1: p1=p2 D. H0: p1≤p2 H1: p1≠p2 E. H0: p1=p2 H1: p1>p2 Your answer is correct. F. H0: p1=p2 H1:…arrow_forwardarrow_back_iosSEE MORE QUESTIONSarrow_forward_ios
Recommended textbooks for you
- MATLAB: An Introduction with ApplicationsStatisticsISBN:9781119256830Author:Amos GilatPublisher:John Wiley & Sons Inc
 Probability and Statistics for Engineering and th...StatisticsISBN:9781305251809Author:Jay L. DevorePublisher:Cengage Learning
 Statistics for The Behavioral Sciences (MindTap C...StatisticsISBN:9781305504912Author:Frederick J Gravetter, Larry B. WallnauPublisher:Cengage Learning
  Elementary Statistics: Picturing the World (7th E...StatisticsISBN:9780134683416Author:Ron Larson, Betsy FarberPublisher:PEARSON
 The Basic Practice of StatisticsStatisticsISBN:9781319042578Author:David S. Moore, William I. Notz, Michael A. FlignerPublisher:W. H. Freeman
 Introduction to the Practice of StatisticsStatisticsISBN:9781319013387Author:David S. Moore, George P. McCabe, Bruce A. CraigPublisher:W. H. Freeman
MATLAB: An Introduction with Applications
Statistics
ISBN:9781119256830
Author:Amos Gilat
Publisher:John Wiley & Sons Inc
Probability and Statistics for Engineering and th...
Statistics
ISBN:9781305251809
Author:Jay L. Devore
Publisher:Cengage Learning
Statistics for The Behavioral Sciences (MindTap C...
Statistics
ISBN:9781305504912
Author:Frederick J Gravetter, Larry B. Wallnau
Publisher:Cengage Learning
Elementary Statistics: Picturing the World (7th E...
Statistics
ISBN:9780134683416
Author:Ron Larson, Betsy Farber
Publisher:PEARSON
The Basic Practice of Statistics
Statistics
ISBN:9781319042578
Author:David S. Moore, William I. Notz, Michael A. Fligner
Publisher:W. H. Freeman
Introduction to the Practice of Statistics
Statistics
ISBN:9781319013387
Author:David S. Moore, George P. McCabe, Bruce A. Craig
Publisher:W. H. Freeman