
Advanced Engineering Mathematics
10th Edition
ISBN: 9780470458365
Author: Erwin Kreyszig
Publisher: Wiley, John & Sons, Incorporated
expand_more
expand_more
format_list_bulleted
Related questions
Question
2.6
4.
pls help
thanks
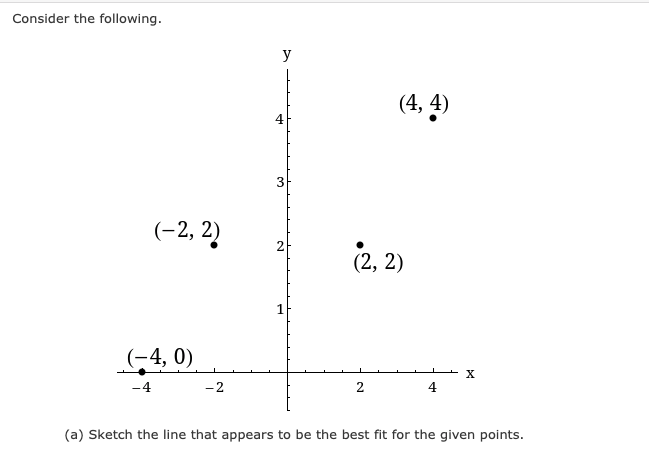

Transcribed Image Text:**Consider the following.**
The diagram is a Cartesian coordinate graph displaying four points plotted on an xy-plane. The axes are labeled \(x\) (horizontal axis) and \(y\) (vertical axis).
**Plotted Points:**
- \((-4, 0)\): This point is located on the x-axis and is 4 units to the left of the origin.
- \((-2, 2)\): This point is positioned in the second quadrant, 2 units left and 2 units up from the origin.
- \((2, 2)\): Situated in the first quadrant, this point is 2 units right and 2 units up from the origin.
- \((4, 4)\): In the first quadrant, this point is 4 units right and 4 units up from the origin.
**Task:**
- (a) Sketch the line that appears to be the best fit for the given points.
To complete the task, a line should be drawn through the points in such a way that minimizes the overall distance from all points to the line, providing a visual estimation of the linear relationship between the variables represented in the graph.
![## Transcription and Explanation
### Image Description
The image consists of four scatter plots, each displaying a red line, and three distinct data points. Each graph is plotted on an x-y coordinate plane with the following labeled points:
1. **First Graph (Top Left):**
- Points: \((-4, 0)\), \((-2, 2)\), \((2, 2)\), and \((4, 4)\).
- Red Line: A diagonal line moving upwards from the bottom left to the top right, passing through the origin and crossing the points \((2, 2)\) and \((4, 4)\).
2. **Second Graph (Top Right):**
- Points: \((-4, 0)\), \((-2, 2)\), \((2, 2)\), and \((4, 4)\).
- Red Line: A horizontal line across \(y = 2\), passing through points \((-2, 2)\) and \((2, 2)\).
3. **Third Graph (Bottom Left):**
- Points: \((-4, 0)\), \((-2, 2)\), \((2, 2)\), and \((4, 4)\).
- Red Line: A steeper diagonal line moving upwards from the bottom left, passing closer to the points \((-2, 2)\) and \((4, 4)\).
4. **Fourth Graph (Bottom Right):**
- Points: \((-4, 0)\), \((-2, 2)\), \((2, 2)\), and \((4, 4)\).
- Red Line: A less steep diagonal compared to the first line, moving upwards from the bottom left and passing near point \((0, 0)\).
### Instructional Text
**(b) Find the least squares regression line. (Round your numerical values to two decimal places.)**
\[ y(x) = \_\_\_\_\_ \]
**(c) Calculate the sum of squared error. (Round your answer to two decimal places.)**
\[ \_\_\_\_\_ \]
### Explanation
The least squares regression line aims to minimize the sum of the squared differences (errors) between the observed points and the points on the line. This concept is fundamental in statistical modeling and helps in making predictions based](https://content.bartleby.com/qna-images/question/c42b80bf-a5d4-414b-bce1-0fe52a04dbbd/82e8f5e7-06f6-4639-95f3-c271dd042795/qglisws_processed.png)
Transcribed Image Text:## Transcription and Explanation
### Image Description
The image consists of four scatter plots, each displaying a red line, and three distinct data points. Each graph is plotted on an x-y coordinate plane with the following labeled points:
1. **First Graph (Top Left):**
- Points: \((-4, 0)\), \((-2, 2)\), \((2, 2)\), and \((4, 4)\).
- Red Line: A diagonal line moving upwards from the bottom left to the top right, passing through the origin and crossing the points \((2, 2)\) and \((4, 4)\).
2. **Second Graph (Top Right):**
- Points: \((-4, 0)\), \((-2, 2)\), \((2, 2)\), and \((4, 4)\).
- Red Line: A horizontal line across \(y = 2\), passing through points \((-2, 2)\) and \((2, 2)\).
3. **Third Graph (Bottom Left):**
- Points: \((-4, 0)\), \((-2, 2)\), \((2, 2)\), and \((4, 4)\).
- Red Line: A steeper diagonal line moving upwards from the bottom left, passing closer to the points \((-2, 2)\) and \((4, 4)\).
4. **Fourth Graph (Bottom Right):**
- Points: \((-4, 0)\), \((-2, 2)\), \((2, 2)\), and \((4, 4)\).
- Red Line: A less steep diagonal compared to the first line, moving upwards from the bottom left and passing near point \((0, 0)\).
### Instructional Text
**(b) Find the least squares regression line. (Round your numerical values to two decimal places.)**
\[ y(x) = \_\_\_\_\_ \]
**(c) Calculate the sum of squared error. (Round your answer to two decimal places.)**
\[ \_\_\_\_\_ \]
### Explanation
The least squares regression line aims to minimize the sum of the squared differences (errors) between the observed points and the points on the line. This concept is fundamental in statistical modeling and helps in making predictions based
Expert Solution
arrow_forward
Step 1
Given data points are:
| x | y |
| -4 | 0 |
| -2 | 2 |
| 2 | 2 |
| 4 | 4 |

Step by stepSolved in 6 steps

Knowledge Booster

Similar questions
arrow_back_ios
SEE MORE QUESTIONS
arrow_forward_ios
Recommended textbooks for you
- Advanced Engineering MathematicsAdvanced MathISBN:9780470458365Author:Erwin KreyszigPublisher:Wiley, John & Sons, Incorporated
 Numerical Methods for EngineersAdvanced MathISBN:9780073397924Author:Steven C. Chapra Dr., Raymond P. CanalePublisher:McGraw-Hill Education
 Introductory Mathematics for Engineering Applicat...Advanced MathISBN:9781118141809Author:Nathan KlingbeilPublisher:WILEY
  Mathematics For Machine TechnologyAdvanced MathISBN:9781337798310Author:Peterson, John.Publisher:Cengage Learning,

Advanced Engineering Mathematics
Advanced Math
ISBN:9780470458365
Author:Erwin Kreyszig
Publisher:Wiley, John & Sons, Incorporated
Numerical Methods for Engineers
Advanced Math
ISBN:9780073397924
Author:Steven C. Chapra Dr., Raymond P. Canale
Publisher:McGraw-Hill Education
Introductory Mathematics for Engineering Applicat...
Advanced Math
ISBN:9781118141809
Author:Nathan Klingbeil
Publisher:WILEY
Mathematics For Machine Technology
Advanced Math
ISBN:9781337798310
Author:Peterson, John.
Publisher:Cengage Learning,