
MATLAB: An Introduction with Applications
6th Edition
ISBN: 9781119256830
Author: Amos Gilat
Publisher: John Wiley & Sons Inc
expand_more
expand_more
format_list_bulleted
Related questions
Question
Please answer question B
b) A machine fills cans with soft drinks so that their contents have a volume of 330ml. Over
a period of time, it has been established that the volume of liquid in the cans follow a
normal distribution with
A setting on the machine is altered, following which the operator suspects that the mean
volume of liquid discharged by the machine into the cans has decreased. He takes a
random sample of 50 cans and finds that the mean volume of liquid in these cans is 334.6
ml. Does this confirm his suspicion? Test at the 5% level of significance.
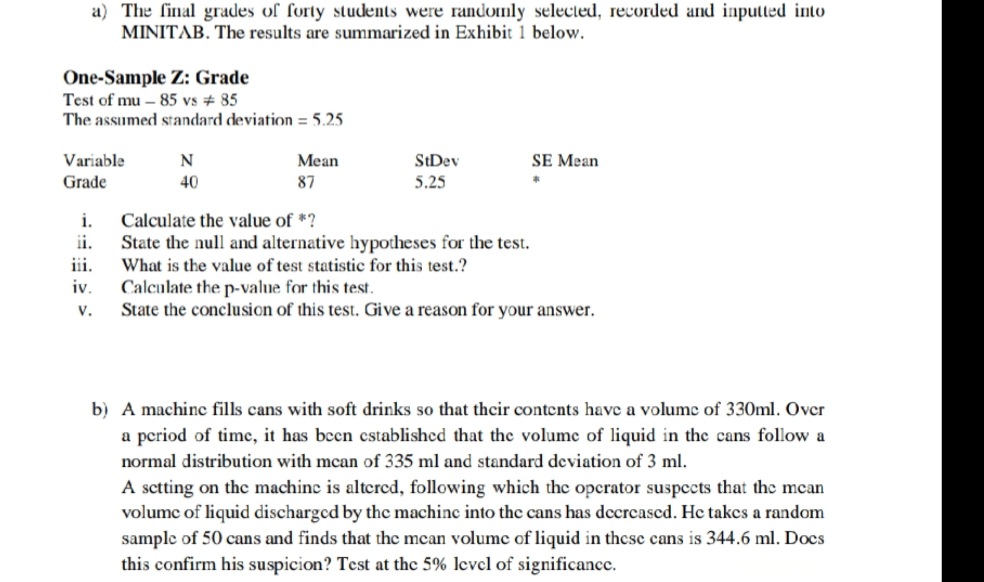

Transcribed Image Text:a) The final grades of forty students were randomly selected, recorded and inputted into
MINITAB. The results are summarized in Exhibit 1 below.
One-Sample Z: Grade
Test of mu-85 vs #85
The assumed standard deviation = 5.25
Variable
Grade
i.
ii.
iii.
iv.
V.
N
40
Mean
87
StDev
5.25
Calculate the value of *?
State the null and alternative hypotheses for the test.
What is the value of test statistic for this test.?
SE Mean
*
Calculate the p-value for this test.
State the conclusion of this test. Give a reason for your answer.
b) A machine fills cans with soft drinks so that their contents have a volume of 330ml. Over
a period of time, it has been established that the volume of liquid in the cans follow a
normal distribution with mean of 335 ml and standard deviation of 3 ml.
A setting on the machine is altered, following which the operator suspects that the mean
volume of liquid discharged by the machine into the cans has decreased. He takes a random
sample of 50 cans and finds that the mean volume of liquid in these cans is 344.6 ml. Docs
this confirm his suspicion? Test at the 5% level of significance.
Expert Solution
This question has been solved!
Explore an expertly crafted, step-by-step solution for a thorough understanding of key concepts.

Step by stepSolved in 3 steps

Knowledge Booster

Similar questions
- Steel rods are manufactured with a mean length of 22 centimeter (cm). Because of variability in the manufacturing process, the lengths of the rods are approximately normally distributed with a standard deviation of 0.06 cm. Click the icon to view a table of areas under the normal curve. (a) What proportion of rods has a length less than 21.9 cm? 0.0475 (Round to four decimal places as needed.) (b) Any rods that are shorter than 21.86 cm or longer than 22.14 cm are discarded. What proportion of rods will be discarded? 0.0196 (Round to four decimal places as needed.) (c) Using the results of part (b), if 5000 rods are manufactured in a day, how many should the plant manager expect to discard? (Use the answer from part b to find this answer. Round to the nearest integer as needed.)arrow_forwardOne of the measurements used to determine the health of a person's lungs is the amount of air a person can exhale under force in one second. This is called forced expiratory volume in one second, and is abbreviated FEV,. Assume the mean FEV, for 10-year-old boys is 2.1 liters that the population standard deviation is o =0.2. A random sample of 53 10-year-old boys live in a community with high levels of ozone pollution are found to have a sample mean FEV, of 2.09 liters. Can you conclude that the mean FEV, in the high-pollution community differs from 2.1 liters? (A) Yes (B) Noarrow_forwardMature maple trees on a specific region have a mean height of 70 feet and a standard deviation of 4 feet. Assuming that heights of maple trees fit a bell-shaped distribution, use the empirical rule to determine the percentage of maple trees we would expect to be between 66 feet and 78 feet tall.arrow_forward
- glucose levels in oatients free of diabetes are assumed to follow a normal distribution with a mean of 120 and a standard deviation of 16. What proportion of patients have glucose levels exceesing 115?arrow_forwardThe mean act composite score of students is 22 with a standard deviation of 3.75. Assume the act scores of students are normally distributed. A friend of yours has an act composite score of 30. Determine your friends percentile rank and round two decimalsarrow_forwardOn a measure of running speed on a 100 meter dash, students received timed scores ranging from 12 seconds to 24 seconds. The distribution of running times is normative with a mean of 16 seconds. Transferring this ratio data to standard scores for comparison with the results of classes from other departments, the mean score is assigned a standard score of 100 with a standard deviation of 10. From this example, a standard score of 99 would mean the actual value in seconds for an individual would be about a. 16 b. 12 c. 19 d. 24arrow_forward
- Steel rods are manufactured with a mean length of 22 centimeter (cm). Because of variability in the manufacturing process, the lengths of the rods are approximately normally distributed with a standard deviation of 0.06 cm. Click the icon to view a table of areas under the normal curve. (a) What proportion of rods has a length less than 21.9 cm? 0.0475 (Round to four decimal places as needed.) (b) Any rods that are shorter than 21.86 cm or longer than 22.14 cm are discarded. What proportion of rods will be discarded? 0.0196 (Round to four decimal places as needed.) (c) Using the results of part (b), if 5000 rods are manufactured in a day, how many should the plant manager expect to discard? 98 (Use the answer from part b to find this answer. Round to the nearest integer as needed.) (d) If an order comes in for 10,000 steel rods, how many rods should the plant manager expect to manufacture if the order states that all rods must be between 21.9 cm and 22.1 cm? (Round up to the nearest…arrow_forwardHumerus bones from the same species of animal have approximately the same length-to-width ratios. It is known that Species A has a mean ratio of 5.9. Suppose that 100 fossil humerus bones were unearthed at a site where Species A is known to have flourished. (We assume that all bones are from the same species.) The length-to-width ratios of these bones have a sample mean 5.6 and sample standard deviation 0.25. Can we conclude that the mean ratio of these bones is significantly smaller than those of Species A? Test with a 0.01 significance level. What is the standard error?arrow_forwardThe number of leaves on apple seedlings aged 2 months followed a normal distribution, the average was 12sheet with a standard deviation of 2. What is the % of plant seeds that have a. at least 10 sheetsb. between 10 to 12 sheetsc. more than 14 sheets.arrow_forward
arrow_back_ios
arrow_forward_ios
Recommended textbooks for you
- MATLAB: An Introduction with ApplicationsStatisticsISBN:9781119256830Author:Amos GilatPublisher:John Wiley & Sons Inc
 Probability and Statistics for Engineering and th...StatisticsISBN:9781305251809Author:Jay L. DevorePublisher:Cengage Learning
 Statistics for The Behavioral Sciences (MindTap C...StatisticsISBN:9781305504912Author:Frederick J Gravetter, Larry B. WallnauPublisher:Cengage Learning
  Elementary Statistics: Picturing the World (7th E...StatisticsISBN:9780134683416Author:Ron Larson, Betsy FarberPublisher:PEARSON
 The Basic Practice of StatisticsStatisticsISBN:9781319042578Author:David S. Moore, William I. Notz, Michael A. FlignerPublisher:W. H. Freeman
 Introduction to the Practice of StatisticsStatisticsISBN:9781319013387Author:David S. Moore, George P. McCabe, Bruce A. CraigPublisher:W. H. Freeman
MATLAB: An Introduction with Applications
Statistics
ISBN:9781119256830
Author:Amos Gilat
Publisher:John Wiley & Sons Inc
Probability and Statistics for Engineering and th...
Statistics
ISBN:9781305251809
Author:Jay L. Devore
Publisher:Cengage Learning
Statistics for The Behavioral Sciences (MindTap C...
Statistics
ISBN:9781305504912
Author:Frederick J Gravetter, Larry B. Wallnau
Publisher:Cengage Learning
Elementary Statistics: Picturing the World (7th E...
Statistics
ISBN:9780134683416
Author:Ron Larson, Betsy Farber
Publisher:PEARSON
The Basic Practice of Statistics
Statistics
ISBN:9781319042578
Author:David S. Moore, William I. Notz, Michael A. Fligner
Publisher:W. H. Freeman
Introduction to the Practice of Statistics
Statistics
ISBN:9781319013387
Author:David S. Moore, George P. McCabe, Bruce A. Craig
Publisher:W. H. Freeman