MATLAB: An Introduction with Applications
6th Edition
ISBN: 9781119256830
Author: Amos Gilat
Publisher: John Wiley & Sons Inc
expand_more
expand_more
format_list_bulleted
Question

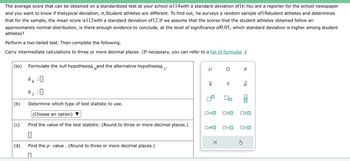
Transcribed Image Text:The average score that can be obtained on a standardized test at your school is114with a standard deviation of 16. You are a reporter for the school newspaper
and you want to know if thetypical deviation, o,Student athletes are different. To find out, he surveys a random sample of 18student athletes and determines
that for the sample, the mean score is112with a standard deviation of12.If we assume that the scores that the student athletes obtained follow an
approximately normal distribution, is there enough evidence to conclude, at the level of significance of 0.05, which standard deviation is higher among student
athletes?
Perform a two-tailed test. Then complete the following.
Carry intermediate calculations to three or more decimal places. (If necessary, you can refer to a list of formulas .)
(to) Formulate the null hypothesish and the alternative hypothesish 1'
ho: 0
0
(b)
(c)
(d)
h !
1
0
Determine which type of test statistic to use.
(Choose an option)
Find the value of the test statistic. (Round to three or more decimal places.)
0
Find the p-value. (Round to three or more decimal places.)
П
μ σ p
XI
0=0 OSO
0#0
S
X
O<O
P
O<O
S

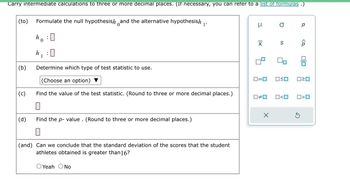
Transcribed Image Text:Carry intermediate calculations to three or more decimal places. (If necessary, you can refer to a list of formulas .)
(to) Formulate the null hypothesish and the alternative hypothesish
ho: 0
0
(b)
(c)
(d)
h :0
1
Determine which type of test statistic to use.
(Choose an option)
Find the value of the test statistic. (Round to three or more decimal places.)
Find the p-value. (Round to three or more decimal places.)
0
1'
(and) Can we conclude that the standard deviation of the scores that the student
athletes obtained is greater than16?
O Yeah O No
μ
X
0=0
S
X
☐#0 0<0
р
<Q
OSO 0²0
3
00
0>0
Expert Solution
This question has been solved!
Explore an expertly crafted, step-by-step solution for a thorough understanding of key concepts.
Step by stepSolved in 3 steps

Knowledge Booster
Similar questions
- It seems these days that college graduates who are employed full-time work more than 40-hour weeks. Data are available that can help us decide if this is true. A survey was recently sent to a group of adults selected at random. There were 15 respondents who were college graduates employed full-time. The mean number of hours worked per week by these 15 respondents was 43 hours, with a standard deviation of 8 hours. Assume that the population of hours worked per week by college graduates employed full-time is normally distributed with mean μ. Can we conclude that μ is greater than 40 hours? Use the 0.05 level of significance. State the null hypothesis H0 and the alternative hypothesis H1 Find the t-test df & Solve the t-test value Find the critical value Can we conclude, at the 0.05 level of significance, that the mean number of hours worked per week by college graduates is greater than 40 hours? Yes or No?arrow_forwardWhat percent of the students received a score below 64, if the mean grade on a test was 70 and the standard deviation was 6. For the same test results as prob 1), what percent of studen ts scored between 64 and 80 .arrow_forwardThe scores on a test are normally distributed with a mean of 150 and a standard deviation of 30. Find the score that is 2 1/2 standard deviations above the mean.arrow_forward
- When engaging in weight-control (fitness/fat burning) types of exercise, a person is expected to attain approximately 60% of his or her maximum heart rate. For 20-year-olds, this rate is approximately 120 bpm. A simple random sample of one hundred 20-year-olds was taken, and the sample mean was found to be 107 bpm, with a standard deviation of 45 bpm. Researchers wonder if this is evidence to conclude that the expected level is actually lower than 120 bpm. To determine this, we test the following hypotheses: Ho: H= 120 versus H₂ μ< 120 Suppose the mean and standard deviation obtained were based on a sample of size 25 rather than 100.arrow_forwardThe mean score for first exam in your first organic chemistry class (section A) was 60, with a standard deviation of 5. Your score on the exam was 70. Your friend took the same exam, but in a different section (section B) of the class. The mean for that section was 70, with a standard deviation of 6. Your friend scored 73 on the exam. What is their z-score?arrow_forwardThe first statistics exam had a mean of 71 and a standard deviation of 11 points; the second had a mean of 84 and a standard deviation of 7 points. Anna scored a 84 on both tests. Megan scored 88 on the first exam and 80 on the second. They both totaled 168 points on the two exams, but Anna claims that her total is better. Explain. The total of Anna's z-scores is 0.6, which is greater than Megan's total of 1 (Round to one decimal place as needed.) 14 14 14. 143 144 145 146 147arrow_forward
- The results of a common standardized test used in psychology research is designed so that the population mean is 175 and the standard deviation is 20. A subject earns a score of 227. What is the z-score for this raw score? Do not round your answer.z-score = ?arrow_forwardThe results of a common standardized test used in psychology research is designed so that the population mean is 175 and the standard deviation is 10. A subject earns a score of 183. What is the z-score for this raw score?arrow_forwardRaul received a score of 77 on a history test for which the class mean was 70 with a standard deviation of 9. He received a score of 75 on a biology test for which the class mean was 70 with standard deviation 4. On which test did he do better relative to the rest of the classarrow_forward
- I'm a bit confused about how to solve this (any help is appreciated)arrow_forwardSuppose Professor Alpha and Professor Omega each teach Introductory Biology. You need to decide which professor to take the class from and have just completed your Introductory Statistics course. Records obtained from past students indicate that students in Professor Alpha's class have a mean score of 80% with a standard deviation of 5%, while past students in Professor Omega's Class have a mean score of 80% with a standard deviation of 10%. Decide which instructor to take for Introductory Biology using a statistical argument.arrow_forwardJeremiah earned a score of 530 on Exam A that had a mean of 450 and a standard deviation of 40. He is about to take Exam B that has a mean of 63 and a standard deviation of 20. How well must Jeremiah score on Exam B in order to do equivalently well as he did on Exam A? Assume that scores on each exam are normally distributed.arrow_forward
arrow_back_ios
SEE MORE QUESTIONS
arrow_forward_ios
Recommended textbooks for you
 MATLAB: An Introduction with ApplicationsStatisticsISBN:9781119256830Author:Amos GilatPublisher:John Wiley & Sons Inc
 Probability and Statistics for Engineering and th...StatisticsISBN:9781305251809Author:Jay L. DevorePublisher:Cengage Learning
 Statistics for The Behavioral Sciences (MindTap C...StatisticsISBN:9781305504912Author:Frederick J Gravetter, Larry B. WallnauPublisher:Cengage Learning
 Elementary Statistics: Picturing the World (7th E...StatisticsISBN:9780134683416Author:Ron Larson, Betsy FarberPublisher:PEARSON
 The Basic Practice of StatisticsStatisticsISBN:9781319042578Author:David S. Moore, William I. Notz, Michael A. FlignerPublisher:W. H. Freeman
 Introduction to the Practice of StatisticsStatisticsISBN:9781319013387Author:David S. Moore, George P. McCabe, Bruce A. CraigPublisher:W. H. Freeman

MATLAB: An Introduction with Applications
Statistics
ISBN:9781119256830
Author:Amos Gilat
Publisher:John Wiley & Sons Inc

Probability and Statistics for Engineering and th...
Statistics
ISBN:9781305251809
Author:Jay L. Devore
Publisher:Cengage Learning

Statistics for The Behavioral Sciences (MindTap C...
Statistics
ISBN:9781305504912
Author:Frederick J Gravetter, Larry B. Wallnau
Publisher:Cengage Learning

Elementary Statistics: Picturing the World (7th E...
Statistics
ISBN:9780134683416
Author:Ron Larson, Betsy Farber
Publisher:PEARSON

The Basic Practice of Statistics
Statistics
ISBN:9781319042578
Author:David S. Moore, William I. Notz, Michael A. Fligner
Publisher:W. H. Freeman

Introduction to the Practice of Statistics
Statistics
ISBN:9781319013387
Author:David S. Moore, George P. McCabe, Bruce A. Craig
Publisher:W. H. Freeman