Micro Economics For Today
10th Edition
ISBN: 9781337613064
Author: Tucker, Irvin B.
Publisher: Cengage,
expand_more
expand_more
format_list_bulleted
Question
not use ai please

Transcribed Image Text:Attempts
Keep the Highest 1/3
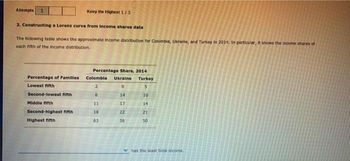
2. Constructing a Lorenz curve from Income shares data
The following table shows the approximate Income distribution for Colombia, Ukraine, and Turkey in 2014. In particular, it shows the income shares of
each fifth of the income distribution.
Percentage Share, 2014
Percentage of Families
Colombia
Ukraine
Turkey
Lowest fifth
2
9
5
Second-lowest fifth
6
14
10
Middle fifth
11
17
14
Second-highest fifth
18
22
21
Highest fifth
63
38
50
has the least total income.

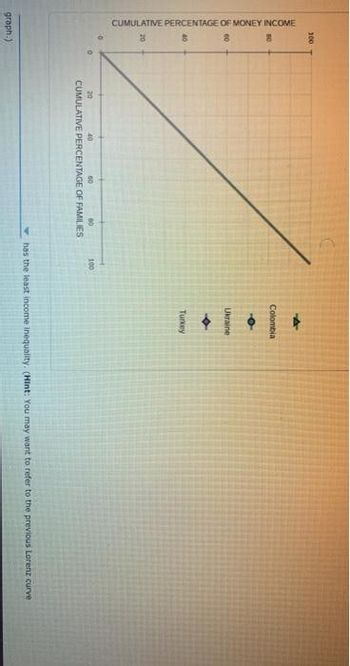
Transcribed Image Text:100
8
CUMULATIVE PERCENTAGE OF MONEY INCOME
20
40
00
60
graph.)
20
40
60
CUMULATIVE PERCENTAGE OF FAMILIES
100
Colombia
O
Ukraine
Turkey
has the least income inequality. (Hint: You may want to refer to the previous Lorenz curve
SAVE
AI-Generated Solution
info
AI-generated content may present inaccurate or offensive content that does not represent bartleby’s views.
Unlock instant AI solutions
Tap the button
to generate a solution
to generate a solution
Click the button to generate
a solution
a solution
Knowledge Booster
Similar questions
- Why is there reluctance on the part of some in the United States to redistribute income so that greater equality can be achieved?arrow_forwardExplain how a country may experience greater equality in the distribution of income, yet still experience high rates of poverty. Hint: Look at the Clear It Up 'How do governments measure poverty in low-income countries?' and compare to Table 15.5.arrow_forwardIf a country had perfect income equality what would the Lorenz curve look like?arrow_forward
- Which set of policies is more likely to cause a tradeoff between economic output and equality: policies of redistribution policies aimed at the ladder of opportunity? Explain how the production possibility frontier tradeoff between economic equality and output might look in each case.arrow_forwardExplain what the long- and short-term consequences are of not promoting equality or working to reduce poverty.arrow_forwardBriefly explain the differences between TANF, the earned income tax credit, SNAP, and Medicaid.arrow_forward
- If a family of three earned 20,000, would they be able to make ends meet given the official poverty threshold?arrow_forwardnd Study Tools tions ccess Tips cess Tips Back 2. Constructing a Lorenz curve from income shares data The following table shows the approximate income distribution for Colombia, Ukraine, and Turkey in 2011. In particular, it shows the income shares of each quintile of the income distribution. Income Group Lowest quintile Second quintile Third quintile Fourth quintile Highest quintile Percentage of Total Income, 2011 Turkey Colombia Ukraine 2 9 5 6 14 10 17 14 21 50 18 63 22 38 has the most total income. On the following graph, plot the Lorenz curves for the three countries. Plot Colombia's Lorenz curve using the green points (triangle symbol), Ukraine's Lorenz curve using the blue points (circle symbol), and Turkey's Lorenz curve using the purple points (diamond symbol) Note: Plot your points in the order in which you would like them connected. Line segments will connect the points automatically.arrow_forwardSummarize what has happened tothe incidence of poverty since 1960, anddetermine when and why the greatestprogress was made in reducing poverty (InCome Differences) List some reasons why householdincomes differ. Which factors are the mostimportant?arrow_forward
arrow_back_ios
SEE MORE QUESTIONS
arrow_forward_ios
Recommended textbooks for you


 Principles of Economics 2eEconomicsISBN:9781947172364Author:Steven A. Greenlaw; David ShapiroPublisher:OpenStax
 Economics (MindTap Course List)EconomicsISBN:9781337617383Author:Roger A. ArnoldPublisher:Cengage Learning
 Principles of MicroeconomicsEconomicsISBN:9781305156050Author:N. Gregory MankiwPublisher:Cengage Learning


Principles of Economics 2e
Economics
ISBN:9781947172364
Author:Steven A. Greenlaw; David Shapiro
Publisher:OpenStax

Economics (MindTap Course List)
Economics
ISBN:9781337617383
Author:Roger A. Arnold
Publisher:Cengage Learning


Principles of Microeconomics
Economics
ISBN:9781305156050
Author:N. Gregory Mankiw
Publisher:Cengage Learning