
Chemistry
10th Edition
ISBN: 9781305957404
Author: Steven S. Zumdahl, Susan A. Zumdahl, Donald J. DeCoste
Publisher: Cengage Learning
expand_more
expand_more
format_list_bulleted
Related questions
Question
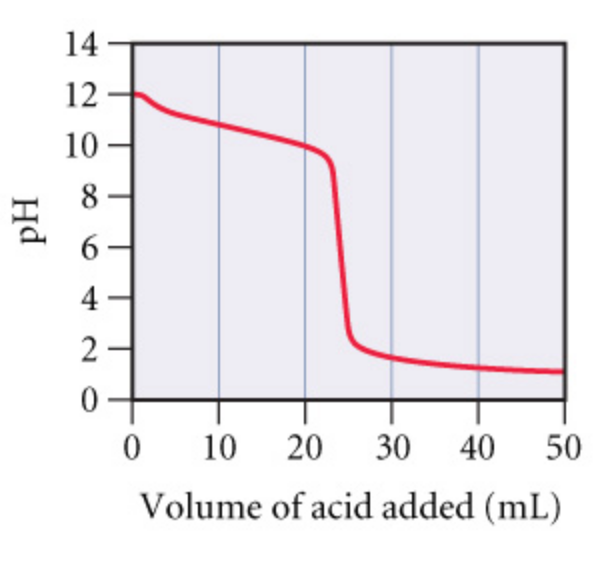

Transcribed Image Text:**Graph Analysis: Titration Curve**
This graph represents the titration curve of a base being titrated with an acid. The x-axis is labeled "Volume of acid added (mL)" and the y-axis is labeled "pH."
- **Initial Phase (0-20 mL):** The pH starts at approximately 12, indicating a basic solution. As the volume of acid increases, the pH gradually decreases.
- **Equivalence Point (Around 25 mL):** There's a steep decline in pH, signifying the equivalence point where the amount of acid added is stoichiometrically equivalent to the base present. The pH drops significantly, indicating a rapid change in acidity.
- **Final Phase (30-50 mL):** After the steep decline, the pH levels off around 2, showing that the solution becomes acidic and further addition of acid does not significantly change the pH.
This curve is typical in a strong base-strong acid titration, where the equivalence point occurs at a pH of around 7. The steepness of the curve near the equivalence point reflects the sudden change in pH when the base is completely neutralized.
![At what volume of added acid does \(\text{pH} = 14 - \text{p}K_b\)?
**Express the volume in milliliters as an integer.**
V = [ ] mL
**Image Description:**
- There is an input box for entering the volume, with some formatting buttons above it, such as symbols for mathematical expressions and undo/redo functions.](https://content.bartleby.com/qna-images/question/1c6de790-3967-4822-b83d-f877aa472903/8858de91-1c5a-4426-a055-7d47af578859/tefgbh8_processed.png)
Transcribed Image Text:At what volume of added acid does \(\text{pH} = 14 - \text{p}K_b\)?
**Express the volume in milliliters as an integer.**
V = [ ] mL
**Image Description:**
- There is an input box for entering the volume, with some formatting buttons above it, such as symbols for mathematical expressions and undo/redo functions.
Expert Solution
This question has been solved!
Explore an expertly crafted, step-by-step solution for a thorough understanding of key concepts.

This is a popular solution

Trending nowThis is a popular solution!

Step by stepSolved in 3 steps with 3 images

Knowledge Booster

Similar questions
- 10. For the following solid Ca3(PO4)2|| a. From the balanced equation for the dissolution reaction b. From the expression of the solubility product (Ksp)arrow_forwardTrue/Falsearrow_forwardCalculate the molar solubility (aq., 20 oC) of aluminum hydroxide, Al(OH)3, in 0.000852 M NaOH. The Ksp of Al(OH)3is 2.0 x 10–32.arrow_forward
- The percent ionization for 0.010 M week monoprotic base is 80% in the reaction Blag) + H,Оф) вн (aq) + ОН (aq), 2 BH"(aq) + OH (aq), "base = 0.80, К, — ? Calculate K, for the base and enter it in the box provided with correct units and sig. figs.: ^): Kp= The base ionization Answer: %3D constant isarrow_forwardWhat is the pH (aq., 25 oC) above which a solution of iron(III) hydroxide will precipitate? Ksp = 2.60 x 10–39.arrow_forwardCalculate the concentration of HNO3 (aq). Estimate the Kb for C2H5NH2 (aq) using the titration curve.arrow_forward
- Complete the following solubility constant expression for CuCO3. Ksp = ☐ = ✗arrow_forwardIn order to form Ba(IO3)2, 500 mL of 0.5000 M Ba(NO3)2 was mixed with 500 mL of 0.0500 M NaIO3. Ksp= 1.57x10^-9What is the concentration of the excess reagent?What is the molar solubility of Ba(IO3)2 in this solution? 2.04x10^-5 M 4.07x10^-5 M 6.15x10^-5 M 8.30x10^-5 Marrow_forwardGive the expression for the solubility product constant for AgCl, based on the following dissolution equation: AgCl(s) Ag+(aq) + Cl-(aq).arrow_forward
- Calculate the volume in liters of 0.545 M KOH necessary to titrate 0.0113 moles of hydrochloric acid, HCl, to a phenolphthalein end-point. Report the answer with three significant figures.arrow_forwardThe solubility of salts that contain the conjugates of weak acids increase in acidic solution. Given the reaction of CUCN (Ksp = 3.47 x 10⁻²⁰) with an acid in the form H3O+ shown below, find the equilibrium constant for this reaction given that Ka HCN = 4.9 x 10⁻¹⁰. CUCN(s) + H:O*(aq) = Cu"(aq) + HCN(aq) + H2O(1)arrow_forwardEnter the solubility expression for Mg, (PO4)₂(s). Ksp =arrow_forward
arrow_back_ios
SEE MORE QUESTIONS
arrow_forward_ios
Recommended textbooks for you
- ChemistryChemistryISBN:9781305957404Author:Steven S. Zumdahl, Susan A. Zumdahl, Donald J. DeCostePublisher:Cengage Learning
 ChemistryChemistryISBN:9781259911156Author:Raymond Chang Dr., Jason Overby ProfessorPublisher:McGraw-Hill Education
 Principles of Instrumental AnalysisChemistryISBN:9781305577213Author:Douglas A. Skoog, F. James Holler, Stanley R. CrouchPublisher:Cengage Learning
  Organic ChemistryChemistryISBN:9780078021558Author:Janice Gorzynski Smith Dr.Publisher:McGraw-Hill Education
 Chemistry: Principles and ReactionsChemistryISBN:9781305079373Author:William L. Masterton, Cecile N. HurleyPublisher:Cengage Learning
 Elementary Principles of Chemical Processes, Bind...ChemistryISBN:9781118431221Author:Richard M. Felder, Ronald W. Rousseau, Lisa G. BullardPublisher:WILEY
Chemistry
Chemistry
ISBN:9781305957404
Author:Steven S. Zumdahl, Susan A. Zumdahl, Donald J. DeCoste
Publisher:Cengage Learning
Chemistry
Chemistry
ISBN:9781259911156
Author:Raymond Chang Dr., Jason Overby Professor
Publisher:McGraw-Hill Education
Principles of Instrumental Analysis
Chemistry
ISBN:9781305577213
Author:Douglas A. Skoog, F. James Holler, Stanley R. Crouch
Publisher:Cengage Learning
Organic Chemistry
Chemistry
ISBN:9780078021558
Author:Janice Gorzynski Smith Dr.
Publisher:McGraw-Hill Education
Chemistry: Principles and Reactions
Chemistry
ISBN:9781305079373
Author:William L. Masterton, Cecile N. Hurley
Publisher:Cengage Learning
Elementary Principles of Chemical Processes, Bind...
Chemistry
ISBN:9781118431221
Author:Richard M. Felder, Ronald W. Rousseau, Lisa G. Bullard
Publisher:WILEY