MATLAB: An Introduction with Applications
6th Edition
ISBN: 9781119256830
Author: Amos Gilat
Publisher: John Wiley & Sons Inc
expand_more
expand_more
format_list_bulleted
Question
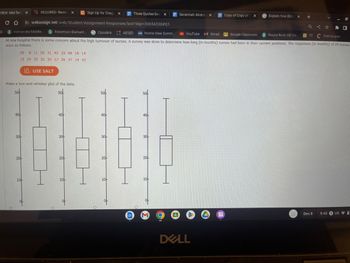
And also what’s the interquartile range

Transcribed Image Text:REQUIRED: Review X C Sign Up for Chegg X
со webassign.net/web/Student/Assignment-Responses/last?dep-30654336#Q1
Classlink AESED HAC Home View Summ....
YouTube M Gmail
Google Classroom
Round Rock ISD Co...
TT
Stemscopes
Hernandez Middle... Robertson Element...
At one hospital there is some concern about the high turnover of nurses. A survey was done to determine how long (in months) nurses had been in their current positions. The responses (in months) of 20 nurses
were as follows.
VIEW: Mid-Term X
D
29 8 11 20 31 42 33 48 18 14
13 29 35 32 34 17 26 37 14 42
40
Make a box-and-whisker plot of the data.
50
30
20-
USE SALT
10
50
40-
30-
20-
10-
50-
40
30-
20
10
of
Three Quotes-Sava X
40
30-
20-
10
of
Savannah Alvarad X
DELL
Copy of Copy of C X
G Explain how Eliza x
+
Q
Dec 8
V
0
9:45 3 USI
Expert Solution
This question has been solved!
Explore an expertly crafted, step-by-step solution for a thorough understanding of key concepts.
This is a popular solution
Trending nowThis is a popular solution!
Step by stepSolved in 2 steps with 2 images

Knowledge Booster
Similar questions
- Could you please show me how to calcualte this (the circled one) on excel, I want the whole formula detail please the answer shown is correct.arrow_forwardExplain in your own words what the distinction between "discrete variables" and "continuous variables" is. Give an example of each (examples should use interval or ratio scales of measurement).arrow_forwardCalculate the range for the following variables assuming they are continuous 2,7,7,3,9,8,7,20arrow_forward
- Calculate the range for the following variables, assumng they are continuous. 5,14,23,20,41,,25,12,22arrow_forwardHow can we differentiate nominal scale & ordinal scale?arrow_forwardMean Temperature (°C) The following scatterplot shows the mean annual carbon dioxide (CO,) in parts per million (ppm) d) What is the meaning of the slope of this equation? measured at the top of a mountain and the mean annual air temperature over both land and sea across the globe, in degrees Celsius (C). Complete parts a through h on the right. O A. For every degree that the mean temperature increases, CO, levels increase by 0.004 ppm. 16.800 O B. For every 0.004 ppm increase in CO, levels, the mean temperature increases by 1°C. 16.725 OC. For every 1 ppm increase in CO, levels, the mean temperature increases by 0.004°C. 16.650 O D. The slope does not have a meaningful interpretation in the context of this problem. 16.575 16.500 e) What is the meaning of the y-intercept of this equation? 337.5 CO, (ppm) 350.03 325.0 362.5 A. For every 1 ppm increase in CO, levels, the mean temperature increases by 0.004°C. Click here to view the regression output. O B. When the CO, level is 0 ppm, the…arrow_forward
arrow_back_ios
arrow_forward_ios
Recommended textbooks for you
 MATLAB: An Introduction with ApplicationsStatisticsISBN:9781119256830Author:Amos GilatPublisher:John Wiley & Sons Inc
 Probability and Statistics for Engineering and th...StatisticsISBN:9781305251809Author:Jay L. DevorePublisher:Cengage Learning
 Statistics for The Behavioral Sciences (MindTap C...StatisticsISBN:9781305504912Author:Frederick J Gravetter, Larry B. WallnauPublisher:Cengage Learning
 Elementary Statistics: Picturing the World (7th E...StatisticsISBN:9780134683416Author:Ron Larson, Betsy FarberPublisher:PEARSON
 The Basic Practice of StatisticsStatisticsISBN:9781319042578Author:David S. Moore, William I. Notz, Michael A. FlignerPublisher:W. H. Freeman
 Introduction to the Practice of StatisticsStatisticsISBN:9781319013387Author:David S. Moore, George P. McCabe, Bruce A. CraigPublisher:W. H. Freeman

MATLAB: An Introduction with Applications
Statistics
ISBN:9781119256830
Author:Amos Gilat
Publisher:John Wiley & Sons Inc

Probability and Statistics for Engineering and th...
Statistics
ISBN:9781305251809
Author:Jay L. Devore
Publisher:Cengage Learning

Statistics for The Behavioral Sciences (MindTap C...
Statistics
ISBN:9781305504912
Author:Frederick J Gravetter, Larry B. Wallnau
Publisher:Cengage Learning

Elementary Statistics: Picturing the World (7th E...
Statistics
ISBN:9780134683416
Author:Ron Larson, Betsy Farber
Publisher:PEARSON

The Basic Practice of Statistics
Statistics
ISBN:9781319042578
Author:David S. Moore, William I. Notz, Michael A. Fligner
Publisher:W. H. Freeman

Introduction to the Practice of Statistics
Statistics
ISBN:9781319013387
Author:David S. Moore, George P. McCabe, Bruce A. Craig
Publisher:W. H. Freeman