MATLAB: An Introduction with Applications
6th Edition
ISBN: 9781119256830
Author: Amos Gilat
Publisher: John Wiley & Sons Inc
expand_more
expand_more
format_list_bulleted
Question

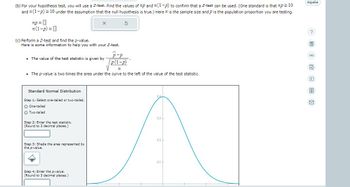
Transcribed Image Text:(b) For your hypothesis test, you will use a Z-test. Find the values of np and n(1-P) to confirm that a Z-test can be used. (One standard is that np≥ 10
and n (1-p) ≥ 10 under the assumption that the null hypothesis i true.) Here 72 is the sample size and p is the population proportion you are testing.
np=0
n(1-p) = 0
(c) Perform a Z-test and find the p-value.
Here is some information to help you with your Z-test.
P-p
p(1-p)
n
• The p-value is two times the area under the curve to the left of the value of the test statistic.
• The value of the test statistic is given by
Standard Normal Distribution
Step 1: Select one-tailed or two-tailed.
O One-tailed
O Two-tailed
Step 2: Enter the test statistic.
(Round to 3 decimal places.)
Step 3: Shade the area represented by
the p-value.
5
Step 4: Enter the p-value.
(Round to 3 decimal places.)
0.3+
02-
0.1-
Espanol
81 @EÙ

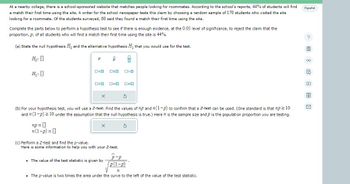
Transcribed Image Text:At a nearby college, there is a school-sponsored website that matches people looking for roommates. According to the school's reports, 44% of students will find
a match their first time using the site. A writer for the school newspaper tests this claim by choosing a random sample of 170 students who visited the site
looking for a roommate. Of the students surveyed, 60 said they found a match their first time using the site.
Complete the parts below to perform a hypothesis test to see if there is enough evidence, at the 0.05 level of significance, to reject the claim that the
proportion, p, of all students who will find a match their first time using the site is 44%.
(a) State the null hypothesis Ho and the alternative hypothesis H₁ that you would use for the test.
Ho: O
Â
H₁: 0
Р
np = 0
n (1-p) = 0
O<O
020 ローロ
OSO
X
Ś
(b) For your hypothesis test, you will use a Z-test. Find the values of np and n(1-p) to confirm that a Z-test can be used. (One standard is that np≥ 10
and 22 (1-p) ≥ 10 under the assumption that the null hypothesis is true.) Here is the sample size and p is the population proportion you are testing.
(c) Perform a Z-test and find the p-value.
Here is some information to help you with your Z-test.
• The value of the test statistic is given by
O<O
0*0
P-p
p(1-p)
n
• The p-value is two times the area under the curve to the left of the value of the test statistic.
Español
?
00
B
!
Expert Solution
This question has been solved!
Explore an expertly crafted, step-by-step solution for a thorough understanding of key concepts.
This is a popular solution
Trending nowThis is a popular solution!
Step by stepSolved in 6 steps with 2 images

Knowledge Booster
Similar questions
- A marketing agency wanted to determine if a new commercial changed people's opinion about a company. They recruited n=30 participants to watch the commercial. First, everyone was givien a survey to determine their attitudes toward the company. Then, everyone watched the new commercial. Finally, they were given the same survey again and asked about their attitudes toward the comapny after seeing the commercial. The agency wanted to see if attitudes were changed by the commercial. What statistical test should they use?arrow_forwarduse a hypothesis test to determine if the proportions are statistically different. A recent survey showed that in a sample of 100 elementary school teachers, 15 were single. In a sample of 180high school teachers, 36 were single. Is the proportion of high school teachers who were single greater than theproportion of elementary teachers who were single? Use ΅ = 0.01.arrow_forwardIn the recent census, three percent of the U.S. population reported being two or more races. However, the percent varies tremendously from state to state. Suppose 2 random surveys are conducted. In the first random survey, out of 1,000 north dakotans, 9 people reported being of two or more races. In a second random survey, out of 500 nevadans, 17 people reported being of 2 or more races. Conduct a hypothesis test to determine if the proportions are the same for the two states or if the proportion for Nevada is statistically different than that of north Dakota.arrow_forward
- As part of a statistics project, Charlie would like to collect data on household size in his city. To do so, he asks each person in his statistics class for the size of their household and reports the results of a simple random sample. However, this is not a simple random sample. Why? O Charlie did not use any randomization; he took a convenience sample. O Charlie did not use a random number table to randomize the order in which he collected the students' responses, so the sample cannot be random. O In this investigation of household size, each household represents a case. Charlie incorrectly sampled individuals instead of households. OBoth (a) and (c) are correct. O Answers (a), (b), and (c) are all correct.arrow_forwardTwo different blood pressure medicines are being compared to determine if the average reduction in blood pressure is the same for each medication. The goal of the study is to determine if the medications differ. Twenty men age 50-60 years old are selected for the study. Ten men are chosen at random to receive the first medication and the other 10 men receive the second medication. Each of the 20 men is monitored for one month to determine the change in blood pressure over that time. Minitab provides the 95% confidence interval for (mu1 - mu2) (2.63, 14.18) a. Interpret this 95% CI. b. What assumptions (be specific) are necessary to construct this CI?arrow_forwardA team of researchers would like to determine whether the number of households that use the internet for more than an hour a day is greater in large cities or small towns. To do so, the researchers take two random samples. The first sample consists of randomly selected people who live in cities with more than 500,000 people around the country. The second sample consists of randomly selected people who live in towns with fewer than 20,000 people. Are these samples dependent or independent? Select the correct answer below: O These samples are independent. O These samples are dependent. Not enough information is provided to determine independence.arrow_forward
- In the Texas senate races, a candidate must clear 50% to avoid a runoff election. In a recent poll of 1040 voters in Texas, 51% of voters preferred candidate. We will a hypothesis test to see if we can say at the 5% significance level that more than 50% of voters in Texas prefer candidate based on this poll. State the null and alternative hypothesis. Find the test-statistic. Find the P-value. Make a conclusion. Interpret your answer.arrow_forwardFor several decades, it was a common practice in Southern California for houses to be built with pools in the backyard (as any airplane flight which ends at a Southern California airport will reveal). Now, however, that practice may be changing, possibly because of the recent demand for landscaped homes, which experts believe help reduce pollution. A recent study examined a random sample of 167 houses built in Southern California between 1950 and 1985 and an independent, random sample of 80 houses built in Southern California from 1992 to the present. The sample of houses built in 1950-1985 contained 71 houses with pools, and the sample of houses built from 1992-present contained 31 houses with pools. Based on this survey, can we conclude, at the 0.05 level of significance, that the proportion p1 of all Southern California houses built in 1950-1985 that were built with pools is greater than the proportion p2 of all Southern California houses built from…arrow_forwardanswer all parts pleasearrow_forward
- Please advise. Keep on tossing a coin until one gets a head. List 2 possible outcomes from this sample.arrow_forward2. In a population it is estimated that 20% have a desired trait of interest for the researcher. The researcher wants to know how many people on average he has to draw from a population to get 2 people with the trait. Use rows 20-24 of the Random Number Table to carry out the simulation. Explain clearly how you set up the problem and report your findings. Answer:arrow_forwardThe local Hannaford is tracking mask compliance in their stores. In mid-March they found that only 40% of customers were wearing masks. They want to know if that percentage increased with the government mandates in place. Select the correct symbols to write the alternate hypothesis for this hypothesis test. Ha:arrow_forward
arrow_back_ios
SEE MORE QUESTIONS
arrow_forward_ios
Recommended textbooks for you
 MATLAB: An Introduction with ApplicationsStatisticsISBN:9781119256830Author:Amos GilatPublisher:John Wiley & Sons Inc
 Probability and Statistics for Engineering and th...StatisticsISBN:9781305251809Author:Jay L. DevorePublisher:Cengage Learning
 Statistics for The Behavioral Sciences (MindTap C...StatisticsISBN:9781305504912Author:Frederick J Gravetter, Larry B. WallnauPublisher:Cengage Learning
 Elementary Statistics: Picturing the World (7th E...StatisticsISBN:9780134683416Author:Ron Larson, Betsy FarberPublisher:PEARSON
 The Basic Practice of StatisticsStatisticsISBN:9781319042578Author:David S. Moore, William I. Notz, Michael A. FlignerPublisher:W. H. Freeman
 Introduction to the Practice of StatisticsStatisticsISBN:9781319013387Author:David S. Moore, George P. McCabe, Bruce A. CraigPublisher:W. H. Freeman

MATLAB: An Introduction with Applications
Statistics
ISBN:9781119256830
Author:Amos Gilat
Publisher:John Wiley & Sons Inc

Probability and Statistics for Engineering and th...
Statistics
ISBN:9781305251809
Author:Jay L. Devore
Publisher:Cengage Learning

Statistics for The Behavioral Sciences (MindTap C...
Statistics
ISBN:9781305504912
Author:Frederick J Gravetter, Larry B. Wallnau
Publisher:Cengage Learning

Elementary Statistics: Picturing the World (7th E...
Statistics
ISBN:9780134683416
Author:Ron Larson, Betsy Farber
Publisher:PEARSON

The Basic Practice of Statistics
Statistics
ISBN:9781319042578
Author:David S. Moore, William I. Notz, Michael A. Fligner
Publisher:W. H. Freeman

Introduction to the Practice of Statistics
Statistics
ISBN:9781319013387
Author:David S. Moore, George P. McCabe, Bruce A. Craig
Publisher:W. H. Freeman