MATLAB: An Introduction with Applications
6th Edition
ISBN: 9781119256830
Author: Amos Gilat
Publisher: John Wiley & Sons Inc
expand_more
expand_more
format_list_bulleted
Question
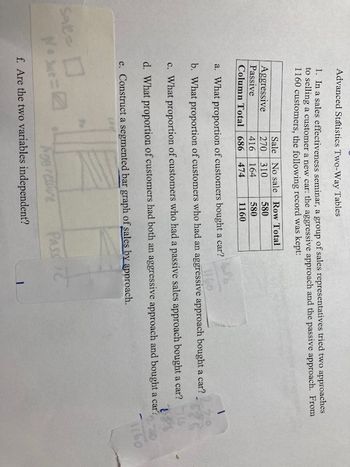
Please answer the attached question, including parts a-f. Please provide the most simple method to determine part f, whether the variables are independent. Thank you.

Transcribed Image Text:Satee
Advanced Statistics Two-Way Tables
1. In a sales effectiveness seminar, a group of sales representatives tried two approaches
to selling a customer a new car: the aggressive approach and the passive approach. From
1160 customers, the following record was kept:
Sale No sale Row Total
Aggressive
270 310
580
Passive
416
164
580
Column Total 686 474
1160
a. What proportion of customers bought a car?
b. What proportion of customers who had an aggressive approach bought a car?
686
c. What proportion of customers who had a passive sales approach bought a car? 16
d. What proportion of customers had both an aggressive approach and bought a car?
281
e. Construct a segmented bar graph of sales by approach.
No Se
f. Are the two variables independent?
Passi
1160
Expert Solution
This question has been solved!
Explore an expertly crafted, step-by-step solution for a thorough understanding of key concepts.
This is a popular solution
Trending nowThis is a popular solution!
Step by stepSolved in 4 steps with 6 images

Knowledge Booster
Similar questions
- Please solve this question in handwriting. Again please need it in handwriting.arrow_forwardThe basketball coach at a local college believes that his team scores more points at home games when more people show up. Below is a list of all home games last year with scores and corresponding attendance. Use Excel, SPSS, or work by hand to show your work finding r. Show your work on the attached pages. Score Attendance Score Attendance 54 380 67 410 57 350 78 215 59 320 67 113 80 478 56 250 82 451 85 450 75 250 101 489 73 489 99 472 53 451 What is the obtained t-score for this correlation? What is the critical t-score for a two-tailed test with a = 0.05? Is this correlation significant based on the t-scores?arrow_forwardFind the value of x.arrow_forward
arrow_back_ios
arrow_forward_ios
Recommended textbooks for you
 MATLAB: An Introduction with ApplicationsStatisticsISBN:9781119256830Author:Amos GilatPublisher:John Wiley & Sons Inc
 Probability and Statistics for Engineering and th...StatisticsISBN:9781305251809Author:Jay L. DevorePublisher:Cengage Learning
 Statistics for The Behavioral Sciences (MindTap C...StatisticsISBN:9781305504912Author:Frederick J Gravetter, Larry B. WallnauPublisher:Cengage Learning
 Elementary Statistics: Picturing the World (7th E...StatisticsISBN:9780134683416Author:Ron Larson, Betsy FarberPublisher:PEARSON
 The Basic Practice of StatisticsStatisticsISBN:9781319042578Author:David S. Moore, William I. Notz, Michael A. FlignerPublisher:W. H. Freeman
 Introduction to the Practice of StatisticsStatisticsISBN:9781319013387Author:David S. Moore, George P. McCabe, Bruce A. CraigPublisher:W. H. Freeman

MATLAB: An Introduction with Applications
Statistics
ISBN:9781119256830
Author:Amos Gilat
Publisher:John Wiley & Sons Inc

Probability and Statistics for Engineering and th...
Statistics
ISBN:9781305251809
Author:Jay L. Devore
Publisher:Cengage Learning

Statistics for The Behavioral Sciences (MindTap C...
Statistics
ISBN:9781305504912
Author:Frederick J Gravetter, Larry B. Wallnau
Publisher:Cengage Learning

Elementary Statistics: Picturing the World (7th E...
Statistics
ISBN:9780134683416
Author:Ron Larson, Betsy Farber
Publisher:PEARSON

The Basic Practice of Statistics
Statistics
ISBN:9781319042578
Author:David S. Moore, William I. Notz, Michael A. Fligner
Publisher:W. H. Freeman

Introduction to the Practice of Statistics
Statistics
ISBN:9781319013387
Author:David S. Moore, George P. McCabe, Bruce A. Craig
Publisher:W. H. Freeman