MATLAB: An Introduction with Applications
6th Edition
ISBN: 9781119256830
Author: Amos Gilat
Publisher: John Wiley & Sons Inc
expand_more
expand_more
format_list_bulleted
Concept explainers
Topic Video
Question

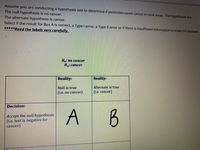
Transcribed Image Text:Assume you are conducting a hypothesis test to determine if pesticides cause cancer in rural areas. The hypotheses are:
The null hypothesis is no cancer.
The alternate hypothesis is cancer.
Select if the result for Box A is correct, a Type I error, a Type II error or if there is insufficient information to make the decision.
*****Read the labels very carefully.
Ho:no cancer
На: сапcer
Reality:
Reality:
Null is true
Alternate is true
(i.e. no cancer)
(i.e. cancer)
Decision:
Accept the null hypothesis
(i.e. test is negative for
cancer)
A B

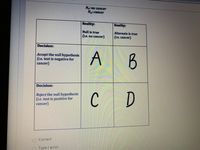
Transcribed Image Text:Ha:no cancer
Ha:cancer
Reality:
Reality:
Null is true
Alternate is true
(i.e. no cancer)
(i.e. cancer)
Decision:
Accept the null hypothesis
(i.e. test is negative for
cancer)
A B
Decision:
Reject the null hypothesis
(i.e. test is positive for
cancer)
C
Correct
O Type I error
Expert Solution
This question has been solved!
Explore an expertly crafted, step-by-step solution for a thorough understanding of key concepts.
This is a popular solution
Trending nowThis is a popular solution!
Step by stepSolved in 2 steps

Knowledge Booster
Learn more about
Need a deep-dive on the concept behind this application? Look no further. Learn more about this topic, statistics and related others by exploring similar questions and additional content below.Similar questions
- The FDA regulates that fish that is consumed is allowed to contain 1 mg/kg of mercury. In Alaska, bass fish were collected in 36 different lakes to measure the amount of mercury in the fish. Do the data provide enough evidence to show that the fish in Alaska lakes has more mercury than the allowable amount? Below, set up the Null Hypothesis Ho and the Alternative Hypothesis HA. Ho: H (? HẠ: H (?arrow_forwardA researcher conducts a hypothesis test on a population proportion. Her null and alternative hypothesis are H0:p = 0.4 and Ha: p < 0.4. The test statistic and p-value for the test are z = -3.01 and p-value = 0.0013. For asignificance level of a= 0.05, choose the correct conclusion regarding the null hypothesis.H0:________________________ Ha:_______________________Compare the p-value and a:_______________Decision:_________________________Conclusion:___________________________________________________________arrow_forwardThe data below were collected to test the effectiveness of a drug to lower systolic blood pressure. Blood pressure (in mm of mercury) was measured before and after treatment for 12 patients; the results are shown. The company claims the drug is effective. Explore this claim through completing the given questions. Assume the population differences is approximately normal and that all conditions for testing are satisfied. Subject A |E F H J G K L Before 200 174 198 170 179 182 193 209 185 155 169 210 After 191 170 177 167 159 151 176 183 159 145 146 177 Before - 9 After 4 21 3 20 31 17 26 26 10 23 33 Blank #1: The individual differences are given because these samples are Fill in the missing parts of the test to show it in its entirety: To explore whether the drug is effective, conduct a significance test using the hypotheses (do before - after as the direction of subtraction) Ho : Hdifference = 0 Ho : Hdifference Blank #2: Determine the correct alternative hypothesis by filling in the…arrow_forward
- 3. Hypothesis #3: Attitudes towards mental health differs by ethnicity. (Use the variable ISTOT labeled Mental Health Attitudes and Ethnicity) MENTAL HEALTH ATTITUDES | 55, 44,33, 43,31 a. Null Hypothesis: NE 5 CAUCASIAN NE 5 HISPANIC N = 5 ASIAN b. Research Hypothesis: 21/88,57, 40, 31 Test Statistic Ran: C. d. Results: Between (Group) Within (Error) Total IV = DV = SS 34,27, 45, 42,56 N= 5 APRICAN AM. 88, 89, 67 78,92 NE 5 OTHER 64,32, 52, 50, 67 df MS vismunu2 8769 F Sig. 0123ione 19 XXXXXXXXXXXXXXXX XXXXXXXXXXXXXXXXXXXXXXXX 10arrow_forwardskip if you already did this and follow instructions do 8 step processarrow_forwardVeterinary services among the Springfeild community would like to create an awareness concerning testing cats for kidney diseases following an article that describes cat's illness testing scenerio as follows : among cats , 2% have kidney diseas. Of test done , 82% can detect the disease when its there, 9.6% of the teat detect the disease when its not there the cat has the disease be D and the cat does not have the disease br D' The test turns positive be P and the test is negative be P' using bayes theorem find probability that cat will have the kidney disease given that the test turns out posiarrow_forward
- Part 1 of 4 If P = 0.03, the result is statistically significant at the a = 0.01 level. The statement is (Choose one) ▼ true false Part 2 of 4 If P = 0.03, the null hypothesis is rejected at the a=0.01 level. The statement is (Choose one) varrow_forwardDescribe type I and type II errors for a hypothesis test of the indicated claim. A shoe store claims that no more than 25% of its new customers will return to buy their next pair of shoes. Describe the type I error. Choose the correct answer below. 16 OA. A type I error will occur when the actual proportion of new customers who return to buy their next pair of shoes is at least 0.25, but you reject Ho: p≥ 0.25. B. A type I error will occur when the actual proportion of new customers who return to buy their next pair of shoes is no more than 0.25, but you fail to reject Ho: p ≤ 0.25. C. A type I error will occur when the actual proportion of new customers who return to buy their next pair of shoes is at least 0.25, but you fail to reject Ho: p≥ 0.25. D. A type I error will occur when the actual proportion of new customers who return to buy their next pair of shoes is no more than 0.25, but you reject Ho: p≤0.25. Describe the type II error. Choose the correct answer below. O A. A type II…arrow_forwardHello can you answer 4 for mearrow_forward
- Suppose you reject the null hypothesis H0: μ = 58. It turns out the population mean is actually equal to 55. You have made Group of answer choices Type I and Type II errors a Type II error a Type I error the correct decisionarrow_forward12arrow_forwardLet’s take another look at the dinosaur example from the first part of the exam. Go ahead and figure out if smoking causes deaths in dinosaurs. Do not forget to follow all the steps of a hypothesis test; use =0.05, write out the conclusion. Smoking Die yes no TOTAL yes 1845 97 1942 no 496 1359 1855 TOTAL 2341 1456 3797arrow_forward
arrow_back_ios
SEE MORE QUESTIONS
arrow_forward_ios
Recommended textbooks for you
 MATLAB: An Introduction with ApplicationsStatisticsISBN:9781119256830Author:Amos GilatPublisher:John Wiley & Sons Inc
 Probability and Statistics for Engineering and th...StatisticsISBN:9781305251809Author:Jay L. DevorePublisher:Cengage Learning
 Statistics for The Behavioral Sciences (MindTap C...StatisticsISBN:9781305504912Author:Frederick J Gravetter, Larry B. WallnauPublisher:Cengage Learning
 Elementary Statistics: Picturing the World (7th E...StatisticsISBN:9780134683416Author:Ron Larson, Betsy FarberPublisher:PEARSON
 The Basic Practice of StatisticsStatisticsISBN:9781319042578Author:David S. Moore, William I. Notz, Michael A. FlignerPublisher:W. H. Freeman
 Introduction to the Practice of StatisticsStatisticsISBN:9781319013387Author:David S. Moore, George P. McCabe, Bruce A. CraigPublisher:W. H. Freeman

MATLAB: An Introduction with Applications
Statistics
ISBN:9781119256830
Author:Amos Gilat
Publisher:John Wiley & Sons Inc

Probability and Statistics for Engineering and th...
Statistics
ISBN:9781305251809
Author:Jay L. Devore
Publisher:Cengage Learning

Statistics for The Behavioral Sciences (MindTap C...
Statistics
ISBN:9781305504912
Author:Frederick J Gravetter, Larry B. Wallnau
Publisher:Cengage Learning

Elementary Statistics: Picturing the World (7th E...
Statistics
ISBN:9780134683416
Author:Ron Larson, Betsy Farber
Publisher:PEARSON

The Basic Practice of Statistics
Statistics
ISBN:9781319042578
Author:David S. Moore, William I. Notz, Michael A. Fligner
Publisher:W. H. Freeman

Introduction to the Practice of Statistics
Statistics
ISBN:9781319013387
Author:David S. Moore, George P. McCabe, Bruce A. Craig
Publisher:W. H. Freeman