
Database System Concepts
7th Edition
ISBN: 9780078022159
Author: Abraham Silberschatz Professor, Henry F. Korth, S. Sudarshan
Publisher: McGraw-Hill Education
expand_more
expand_more
format_list_bulleted
Related questions
Question
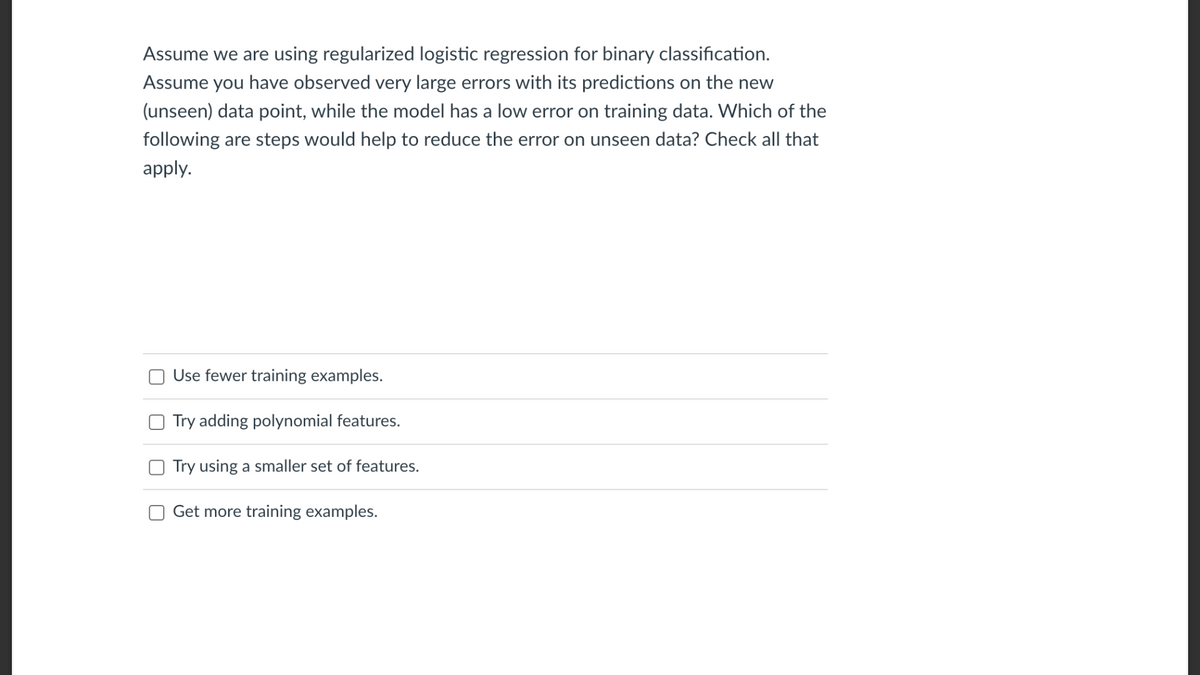

Transcribed Image Text:Assume we are using regularized logistic regression for binary classification.
Assume you have observed very large errors with its predictions on the new
(unseen) data point, while the model has a low error on training data. Which of the
following are steps would help to reduce the error on unseen data? Check all that
apply.
Use fewer training examples.
Try adding polynomial features.
Try using a smaller set of features.
Get more training examples.
Expert Solution
This question has been solved!
Explore an expertly crafted, step-by-step solution for a thorough understanding of key concepts.

Step by stepSolved in 3 steps

Knowledge Booster


Learn more about
Need a deep-dive on the concept behind this application? Look no further. Learn more about this topic, computer-science and related others by exploring similar questions and additional content below.Similar questions
- The lower the misclassification rate, the better the predictive performance of a logistic regression model. True False PLEASE ANSWER CORRECTLYarrow_forwardMake sure to show it as steps on a python with the final answer Fit a decision tree model using the training dataset (`x_train` and `y_train`)Create a variable named `y_pred`. Make predictions using the `x_test` variable and save these predictions to the y_pred variable Create a variable called `dt_accuracy`. Compute the accuracy rate of the logistic regression model using the `y_pred` and `y_test` and assign it to the `dt_accuracy` variablearrow_forwardPlease provide steps to answer this question: Your task is simple: use machine learning to create a model that predicts which passengers survived the Titanic shipwreck. Implement and train a classification model for the Titanic dataset (the dataset can be found here: https://www.kaggle.com/c/titanic). Please ignore the test set (i.e., test.csv) and consider the given train set (i.e., train.csv) as the dataset. What you need to do: 1. Data cleansing 2. Split the dataset (i.e., train.csv) into a training set (80% samples) and a testing set (20% samples) 3. Train your model (see details below) 4. Report the overall classification accuracies on the training and testing sets 5. Report the precision, recall, and F-measure scores on the testing setarrow_forward
- You trained the regression model with 100 regressors and 1000 observations in the training and another 1000 in the test sample. You found that in-sample R2 over the training sample is 70% and the out-of-sample R2 over the test sample only - 30%. (select all that apply) a) Do you think there is any problem and how would you characterize it? Can adding more regressors (if you have them) help the model? b) Which approaches you may use to solve the problem? c) What would you expect the in-sample R2 to increase or decrease after that? What about the out-of-sample (test) R2?arrow_forwardWhy use LASSO shrinkage methods for linear regression? Select ALL that are correct. They allow for greater model interpretability. They increase the prediction accuracy of linear regression on training data. They slightly decrease bias and can substantially decrease the variance of the model. They slightly increase bias, but can substantially decrease the variance of the model.arrow_forwardThe benefits of switching to all-subsets regression from stepwise regression are broken forth in great depth below. .arrow_forward
- You are working on a spam classification system using regularized logistic regression. "Spam" is a positive class (y = 1)and "not spam" is the negative class (y=0). You have trained your classifier and there are m= 1000 examples in the cross-validation set. The chart of predicted class vs. actual class is: Predicted class: 1 Predicted class: 0 Actual class: 1 85 15 For reference: Accuracy = (true positives + true negatives)/(total examples) Precision = (true positives)/(true positives + false positives) Recall = (true positives)/ (true positives + false negatives) F1 score = (2* precision * recall)/(precision + recall) What is the classifier's F1 score (as a value from 0 to 1)? Write all steps Use the editor to format your answer Actual class: 0 890 10arrow_forwardWe've built a logistic regression model in RapidMiner, and would like to use it to make predictions for some new data points. Which operator do we need: Performance Apply Model Cross Validation O Nominal to Numerical.arrow_forwardFor evaluation of regression models, typically, the higher the [ Select ] ["Adjusted R Squared", "Residual Standard Error"] the better, and the lower the [ Select ] ["Adjusted R Squared", "Residual Standard Error"] , the better.arrow_forward
- Question 48. Let us return to the Titanic data set. We now have learned several models and want to choose the best one. We used three different methods to validate these models: The training error rate (apparent error rate), the error rate on an external test set and the error rate estimated by a 10-fold cross validation. Training Error | Error on the test set | Cross Validation Error 0.18 Learner Decision Tree 0.22 0.21 Random Forest 0.01 0.10 0.12 1-Nearest-Neighbour 0.18 0.19 Which of the following statements are correct? a) 1-Nearest-Neighbour has a perfect training error and hence it should be used here. b) Random Forests outperforms both 1-Nearest-Neighbour and the Decision Tree in terms of prediction error. c) Not just in this case, but in general, Cross Validation is the better validation strategy and should always be preferred over the error on a single test set. d) Not just in this case, but in general, Decision Trees always perform worse than Random Forests.arrow_forwardThis is a binary classification problem, y has two values (0 or 1), and X (feature) has three dimensions. • Use a logistic regression model to project X to y (classify X into two categories: 0 or 1). • The initialization is: w1 = 0, w2 = 0, w3 = 0, b = 0, Learning rate is 2. • You must use Gradient Descent for logistic regression in this question. • The regression should stop after one iteration. Calculation process and formulas must be included in your answer! You must answer this question by manual calculation, but not programming.arrow_forwardAssume the following simple regression model, Y = β0 + β1X + ϵ ϵ ∼ N(0, σ^2 ) Now run the following R-code to generate values of σ^2 = sig2, β1 = beta1 and β0 = beta0. Simulate the parameters using the following codes: Code: # Simulation ## set.seed("12345") beta0 <- rnorm(1, mean = 0, sd = 1) ## The true beta0 beta1 <- runif(n = 1, min = 1, max = 3) ## The true beta1 sig2 <- rchisq(n = 1, df = 25) ## The true value of the error variance sigmaˆ2 ## Multiple simulation will require loops ## nsample <- 10 ## Sample size n.sim <- 100 ## The number of simulations sigX <- 0.2 ## The variances of X # # Simulate the predictor variable ## X <- rnorm(nsample, mean = 0, sd = sqrt(sigX)) Q1 Fix the sample size nsample = 10 . Here, the values of X are fixed. You just need to generate ϵ and Y . Execute 100 simulations (i.e., n.sim = 100). For each simulation, estimate the regression coefficients (β0, β1) and the error variance (σ 2 ). Calculate the mean of…arrow_forward
arrow_back_ios
SEE MORE QUESTIONS
arrow_forward_ios
Recommended textbooks for you
- Database System ConceptsComputer ScienceISBN:9780078022159Author:Abraham Silberschatz Professor, Henry F. Korth, S. SudarshanPublisher:McGraw-Hill Education
 Starting Out with Python (4th Edition)Computer ScienceISBN:9780134444321Author:Tony GaddisPublisher:PEARSON
 Digital Fundamentals (11th Edition)Computer ScienceISBN:9780132737968Author:Thomas L. FloydPublisher:PEARSON
  C How to Program (8th Edition)Computer ScienceISBN:9780133976892Author:Paul J. Deitel, Harvey DeitelPublisher:PEARSON
 Database Systems: Design, Implementation, & Manag...Computer ScienceISBN:9781337627900Author:Carlos Coronel, Steven MorrisPublisher:Cengage Learning
 Programmable Logic ControllersComputer ScienceISBN:9780073373843Author:Frank D. PetruzellaPublisher:McGraw-Hill Education
Database System Concepts
Computer Science
ISBN:9780078022159
Author:Abraham Silberschatz Professor, Henry F. Korth, S. Sudarshan
Publisher:McGraw-Hill Education
Starting Out with Python (4th Edition)
Computer Science
ISBN:9780134444321
Author:Tony Gaddis
Publisher:PEARSON
Digital Fundamentals (11th Edition)
Computer Science
ISBN:9780132737968
Author:Thomas L. Floyd
Publisher:PEARSON
C How to Program (8th Edition)
Computer Science
ISBN:9780133976892
Author:Paul J. Deitel, Harvey Deitel
Publisher:PEARSON
Database Systems: Design, Implementation, & Manag...
Computer Science
ISBN:9781337627900
Author:Carlos Coronel, Steven Morris
Publisher:Cengage Learning
Programmable Logic Controllers
Computer Science
ISBN:9780073373843
Author:Frank D. Petruzella
Publisher:McGraw-Hill Education