
MATLAB: An Introduction with Applications
6th Edition
ISBN: 9781119256830
Author: Amos Gilat
Publisher: John Wiley & Sons Inc
expand_more
expand_more
format_list_bulleted
Related questions
Question
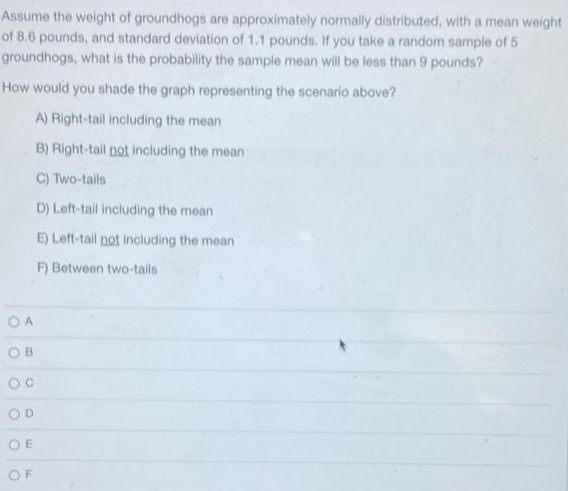

Transcribed Image Text:Assume the weight of groundhogs are approximately normally distributed, with a mean weight
of 8.6 pounds, and standard deviation of 1.1 pounds. If you take a random sample of 5
groundhogs, what is the probability the sample mean will be less than 9 pounds?
How would you shade the graph representing the scenario above?
A) Right-tail including the mean
B) Right-tail not including the mean
C) Two-tails
D) Left-tail including the mean
E) Left-tail not including the mean
F) Between two-tails
OA
OB
OD
OE
OF
Expert Solution
This question has been solved!
Explore an expertly crafted, step-by-step solution for a thorough understanding of key concepts.

This is a popular solution

Trending nowThis is a popular solution!

Step by stepSolved in 3 steps with 5 images

Knowledge Booster

Similar questions
- Suppose the average amount of money that people spend on their pets per month is 47 dollars, with a standard deviation of 6 dollars. For a sample of 36 people, final the average amount of money spent on pets that defines the bottom 30% in the distribution.For a sample of 36 people, what is the probability for this sample’s mean to be higher than 50 dollars.arrow_forwardProblem: The number of misdirected luggage cases reported for 5 consecutive weeks at the domestic airport were: 4, 5, 7, 8, 61. Compute the Mean, Median, Range, Interquartile Range, Variance and Standard deviation.arrow_forwardFive students took a self-confidence test. Their deviation scores were –4, +3, +1, –2, and +2. Assuming that these scores com form a normaldistribution, which deviation represents the highest raw score?arrow_forward
- The mean GPA of all 45,038 students at Uneeda College is 3.21. A random sample of 50 GPAs from the school has a mean of 3.16. Is the value 3.21 a parameter or a statistic?arrow_forward7. A set of data has a variance of 81. What is the standard deviation? SAMSUNGarrow_forward8. An HP laser printer is advertised to print text documents at a speed of 18 ppm (pages per minute). The manufacturer tells you that the printing speed is actually a Normal random variable with a mean of 17.57 ppm and a standard deviation of 3 ppm. A Brother brand printer can print an average of 17.21 ppm and a standard deviation of 4 pages and its printer speed is also normally distributed. You select 10 of each printer at random. What is the probability that mean Brother print speed is at least 2 pages faster than the mean HP print speed?arrow_forward
- Part I A bakery sells homemade bread by the loaf and sales are uniformly distributed between 200 and 600 loaves per day. a. Find the probability of selling 240 loaves on a given day. b. Find the probability of selling between 250 and 260 loaves per day Part II The golf balls produced by TruGolf have a mean distance of 250 meters and a variance of 625 meters. c. How large a sample of TruGolf balls should be taken if they want to estimate with 90% confidence the mean distance to within 8 meters? d A random sample of 40 balls from TruGolf are selected. Find the Bound of Error when the confidence level is 95% for TruGolfarrow_forwardThe histogram (click the attacthed photo to view) shows the distribution of hurricanes that have hit a country from 1851 through 2015, where 1 is the weakest level and 5 is the strongest level. A) The mean is? B) The variance is? C)The standard deviation is?arrow_forwardUsing a pooled sample estimator, o , assumes the two populations have O A. different means. O B. the same mean. O C. the same variance. O D. different variances.arrow_forward
arrow_back_ios
arrow_forward_ios
Recommended textbooks for you
- MATLAB: An Introduction with ApplicationsStatisticsISBN:9781119256830Author:Amos GilatPublisher:John Wiley & Sons Inc
 Probability and Statistics for Engineering and th...StatisticsISBN:9781305251809Author:Jay L. DevorePublisher:Cengage Learning
 Statistics for The Behavioral Sciences (MindTap C...StatisticsISBN:9781305504912Author:Frederick J Gravetter, Larry B. WallnauPublisher:Cengage Learning
  Elementary Statistics: Picturing the World (7th E...StatisticsISBN:9780134683416Author:Ron Larson, Betsy FarberPublisher:PEARSON
 The Basic Practice of StatisticsStatisticsISBN:9781319042578Author:David S. Moore, William I. Notz, Michael A. FlignerPublisher:W. H. Freeman
 Introduction to the Practice of StatisticsStatisticsISBN:9781319013387Author:David S. Moore, George P. McCabe, Bruce A. CraigPublisher:W. H. Freeman
MATLAB: An Introduction with Applications
Statistics
ISBN:9781119256830
Author:Amos Gilat
Publisher:John Wiley & Sons Inc
Probability and Statistics for Engineering and th...
Statistics
ISBN:9781305251809
Author:Jay L. Devore
Publisher:Cengage Learning
Statistics for The Behavioral Sciences (MindTap C...
Statistics
ISBN:9781305504912
Author:Frederick J Gravetter, Larry B. Wallnau
Publisher:Cengage Learning
Elementary Statistics: Picturing the World (7th E...
Statistics
ISBN:9780134683416
Author:Ron Larson, Betsy Farber
Publisher:PEARSON
The Basic Practice of Statistics
Statistics
ISBN:9781319042578
Author:David S. Moore, William I. Notz, Michael A. Fligner
Publisher:W. H. Freeman
Introduction to the Practice of Statistics
Statistics
ISBN:9781319013387
Author:David S. Moore, George P. McCabe, Bruce A. Craig
Publisher:W. H. Freeman