ENGR.ECONOMIC ANALYSIS
14th Edition
ISBN: 9780190931919
Author: NEWNAN
Publisher: Oxford University Press
expand_more
expand_more
format_list_bulleted
Question
Hand written solution is not allowed my dear great expert.

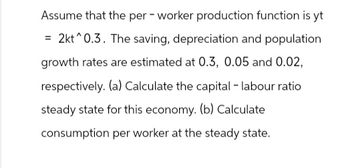
Transcribed Image Text:Assume that the per-worker production function is yt
=2kt 0.3. The saving, depreciation and population
growth rates are estimated at 0.3, 0.05 and 0.02,
respectively. (a) Calculate the capital - labour ratio
steady state for this economy. (b) Calculate
consumption per worker at the steady state.
Expert Solution
This question has been solved!
Explore an expertly crafted, step-by-step solution for a thorough understanding of key concepts.
This is a popular solution
Trending nowThis is a popular solution!
Step by stepSolved in 4 steps with 2 images

Knowledge Booster
Learn more about
Need a deep-dive on the concept behind this application? Look no further. Learn more about this topic, economics and related others by exploring similar questions and additional content below.Similar questions
- Write the formula of Annual Effective Yields?arrow_forwardBVM manufactured and sold 25,000 small statues this past year. At that volume, the firm was exactly in a breakeven situation in terms of profitability. BVM’s unit costs are expected to increase by 30% next year. What additional information is needed to determine how much the production volume/sales would have to increase next year to just break even in terms of profitability? (a) Costs per unit (b) Sales price per unit and costs per unit (c) Total fixed costs, sales price per unit, and costs per unit (d) No data is needed, the volume increase is 25, 000 + 25, 000(0.30) = 32, 500 units.arrow_forwardS LO 20 # 3 PRICE (Dollars per hot dog) 5. History Bookmarks People Tab Window Help 令) 71% Mind Tap - Cengage Learning /index.html?deploymentld%359828119415547787292595253&elSBN=9780357133606&id%3D1069413986&snapshotid%-D2211990& * CENGAGE MINDTAP Q Search this course Homework (Ch 15) 5. Monopoly outcome versus competition outcome Consider the daily market for hot dogs in a small city. Suppose that this market is in long-run competitive equilibrium with many hot dog stands in the city, each one selling the same kind of hot dogs. Therefore, each vendor is a price taker and possesses no market power. The following graph shows the demand (D) and supply (S = MC) curves in the market for hot dogs. %3D Place the black point (plus symbol) on the graph to indicate the market price and quantity that will result from competition. Competitive Market +. 4.5 PC Outcome 3.5 3.0 2.5 S=MC 1.5 0.5 D. 120 140 160 180 09 QUANTITY (Hot dogs) 40 PI MacBook Air DA DD F8 F6 F5 F4 F2 %24 6. 7. 8. 9- 4. 2.arrow_forward
- I will split this question into two parts per the Q&A guidlines and leave a like for your assistance, thank you.Background:New Pumper system equipment is under consideration by a gulf coast chemical processing plant. One crucial pump moves highly corrosive liquids from specially lined tanks on intercoastal barges into storage and preliminary refining facilities dockside. Beacuse of the variable quality of the raw chemical and the igh pressures imposed on the pump chassis and impellers, a close log is maintained on the number of hours per year that the pump operates safety records and pump componenet deterioration are considered critical control points for this system. As currently planned, rebuild and M&O cost estimates are increased accordingly when cummulative operating time reaches the 6000-hour mark. Information:- First cost: $800,000- Rebuild Cost: $150,000 whenever 6000 cumulative hours are logged. Each rework will cost 20% more than the previous one. A maximum of three…arrow_forwardGiven the following information for an insurance company that writes 24-month term policies: Number of Vehicles 50 100 Policy Group A B Effective Date January 1, 2010 Expiration Date December 31, 2011 July 1, 2010 June 30, 2012 All policies within each group have the same effective date. (a) Calculate the earned car-years for calendar year 2011. (b) Calculate the earned car-years for policy year 2010 evaluated as of December 31, 2010 and as of December 31, 2011. (c) Assume Policy Group B cancels on January 1, 2011. Calculate the 2010 policy year written car- years evaluated as of December 31, 2010 and as of December 31, 2011 for Policy Group B. (d) Assume Policy Group B cancels on July 1, 2011. Calculate the 2010 and 2011 calendar year written car-years for Policy Group B.arrow_forwardthe impact of NEMA and IEC to malaysia industries and society All explanations given must be provided with detailed references/figures/charts/infographics.arrow_forward
arrow_back_ios
arrow_forward_ios
Recommended textbooks for you

 Principles of Economics (12th Edition)EconomicsISBN:9780134078779Author:Karl E. Case, Ray C. Fair, Sharon E. OsterPublisher:PEARSON
 Engineering Economy (17th Edition)EconomicsISBN:9780134870069Author:William G. Sullivan, Elin M. Wicks, C. Patrick KoellingPublisher:PEARSON
 Principles of Economics (MindTap Course List)EconomicsISBN:9781305585126Author:N. Gregory MankiwPublisher:Cengage Learning
 Managerial Economics: A Problem Solving ApproachEconomicsISBN:9781337106665Author:Luke M. Froeb, Brian T. McCann, Michael R. Ward, Mike ShorPublisher:Cengage Learning
 Managerial Economics & Business Strategy (Mcgraw-...EconomicsISBN:9781259290619Author:Michael Baye, Jeff PrincePublisher:McGraw-Hill Education


Principles of Economics (12th Edition)
Economics
ISBN:9780134078779
Author:Karl E. Case, Ray C. Fair, Sharon E. Oster
Publisher:PEARSON

Engineering Economy (17th Edition)
Economics
ISBN:9780134870069
Author:William G. Sullivan, Elin M. Wicks, C. Patrick Koelling
Publisher:PEARSON

Principles of Economics (MindTap Course List)
Economics
ISBN:9781305585126
Author:N. Gregory Mankiw
Publisher:Cengage Learning

Managerial Economics: A Problem Solving Approach
Economics
ISBN:9781337106665
Author:Luke M. Froeb, Brian T. McCann, Michael R. Ward, Mike Shor
Publisher:Cengage Learning

Managerial Economics & Business Strategy (Mcgraw-...
Economics
ISBN:9781259290619
Author:Michael Baye, Jeff Prince
Publisher:McGraw-Hill Education