
MATLAB: An Introduction with Applications
6th Edition
ISBN: 9781119256830
Author: Amos Gilat
Publisher: John Wiley & Sons Inc
expand_more
expand_more
format_list_bulleted
Related questions
Question
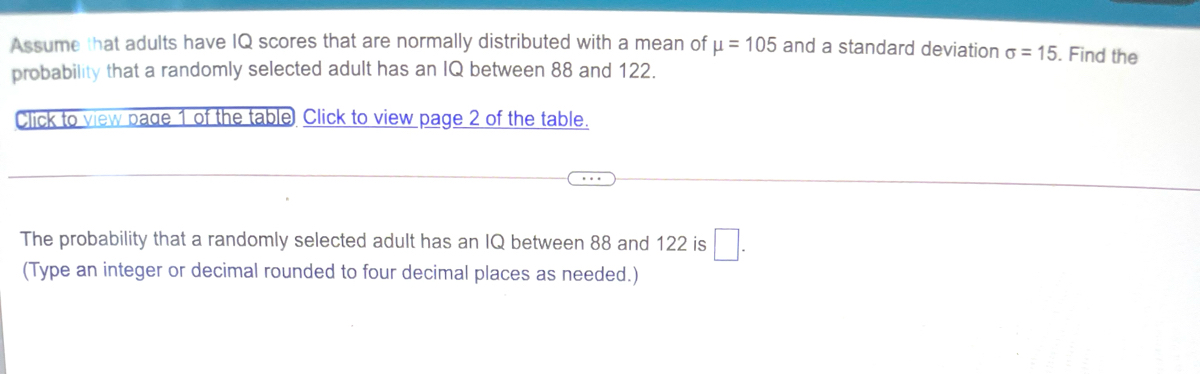

Transcribed Image Text:Assume that adults have lQ scores that are normally distributed with a mean of µ = 105 and a standard deviation g = 15 Find the
probability that a randomly selected adult has an IQ between 88 and 122.
Click to view page 1 of the table Click to view page 2 of the table.
...
The probability that a randomly selected adult has an IQ between 88 and 122 is
(Type an integer or decimal rounded to four decimal places as needed.)

Transcribed Image Text:0.
Standard Normal (z) Distribution: Cumulative Area from the LEFT
.00
.01
02
.03
.04
O5
06
.07
.08
.09
n IQ be
places
-3.50
and
lower
0001
-3.4
0003
0003
0003
0003
.0003
0003
.0003
0003
.0003
.0002
-3.3
.0005
0005
.0005
.0004
0004
.0004
0004
.0004
0004
.0003
-3.2
.0007
0007
0006
0006
0006
,0006
0006
.0005
0005
,0005
-31
0010
.0009
0009
0009
0008
.0008
0008
.0008
0007
0007
-3.0
0013
.O013
0013
.0012
0012
.0011
0011
.0011
0010
.0010
-2.9
.O019
O018
0018
사.0017
.0016
.0016
0015
.0015
.0014
.0014
-2.8
.0026
0025
0024
.0023
.0023
.0022
.0021
.0021
.0020
.O019
-2.7
.0035
0034
.0033
.0032
.0031
.0030
.0029
.0028
0027
.0026
-2.6
0047
0045
0044
0043
.0041
.0040
.0039
0038
0037
0036
-2.5
0062
.0060
O059
.0057
0055
.0054
.O052
• 0049
.0051
0048
-2.4
.0082
.0080
.0078
.0075
.0073
.0071
0069
.0068
.0066
0064
-2.3
0107
0104
0102
.0099
.0096
.0094
0091
.0089
.0087
.0084
-2.2
0139
0136
.0132
.0129
.0125
.0122
0119
.0116
0113
0110
-21
0179
0174
.0170
.0166
.0162
.0158
.0154
.0150
0146
.0143
-2.0
.0228
.0222
.0217
.0212
0207
.0202
0197
0192
0188
.0183
-1.9
.0287
.0281
.0274
.0268
.0262
.0256
.0250
.0244
0239
.0233
-1.8
.0359
.0351
.0344
.0336
.0329
.0322
.0314
.0307
.0301
.0294
-1.7
0446
.0436
0427
.0418
0409
.0401
0392
.0384
0375
0367
-1.6
0548
0537
• 0495
.0618 A .0606
0526
.0516
.0505
0485
.0475
.0465
.0455
-1.5
.0668
.0655
.0643
.0630
.0594
.0582
.0571
0559
-1.4
.0808
.0793
.0778
.0749
.0901
.0764
.0735
0721
.0708
0694
.0681
-13
.0968
.0951
.0934
.0918
.0885
.0869
.0853
0838
.0823
-1.2
1151
1131
112
1093
1075
1056
1038
1020
.1003
0985
-11
1357
1335
1314
.1292
.1271
1251
1230
.1210
1190
1170
-1.0
1587
1562
.1539
1515
1492
1469
1446
.1423
1401
1379
-0.9
.1841
1814
1788
1762
1736
1711
1685
1660
1635
1611
-0.8
2119
2090
2061
2033
2005
1977
1949
,1922
.1894
.1867
-0.7
2420
2389
2358
2327
2296
.2266
2236
2206
2177
2148
-0.6
2743
2709
2676
2643
2611
2578
2546
2514
2483
2451
Expert Solution
This question has been solved!
Explore an expertly crafted, step-by-step solution for a thorough understanding of key concepts.

This is a popular solution

Trending nowThis is a popular solution!

Step by stepSolved in 2 steps with 2 images

Knowledge Booster

Similar questions
- Assume that adults have IQ scores that are normally distributed with a mean of μ = 105 and a standard deviation o=20. Find the probability that a randomly selected adult has an IQ between 88 and 122. Click to view page 1 of the table. Click to view page 2 of the table. The probability that a randomly selected adult has an IQ between 88 and 122 is (Type an integer or decimal rounded to four decimal places as needed.) Carrow_forwardPlease use the information provide in the picture to answer the question in the other picturearrow_forwardFind the minimum sample size n needed to estimate μ for the given values of c, σ, and E. c=0.90, σ=7.5, and E=2 Assume that a preliminary sample has at least 30 members. n=nothing (Round up to the nearest whole number.)arrow_forward
- Suppose that the speeds of cars travelling on California freeways are normally distributed with a mean of 62 miles/hour. The highway patrol's policy is to issue tickets for cars with speeds exceeding 75 miles/hour. The records show that exactly 2% of the speeds exceed this limit. Find the standard deviation of the speeds of cars travelling on California freeways. Carry your intermediate computations to at least four decimal places. Round your answer to at least one decimal place.arrow_forwardAssume that the heights of women are normally distributed with a mean of 63.6 inches and a standard deviation of 2.5 inches. If 100 women are randomly selected, find the probability that they have a mean height greater than 63.0 inches. O A. 0.0082 O B. 0.8989 O C. 0.2881 O D. 0.9918 Next View Instructor Tip Calculator 809 PM 70°F Cloudy 10/8/2021 33 2 Type here to search 10/05/17 PrtSc Insert Delete AI F9 F10 F11 F12 F7 F8 F5 F6 Esc F3 F4 F1 & Backspace Num Lock C@ %23 5 7 080 3 T. Y కాం Home C Tab H. K Enter G A CapsLk 1 Shift C V N End hift PgUp Alt Ctrl End + |/ A MI 小 44arrow_forwardThe mean time taken by all participants to run a road race was found to be 110 minutes with a standard deviation of 15 minutes. Using Chebyshev's theorem, find the percentage of runners who ran this road race in 80 to 140 minutes. Round your answer to the nearest integer. ofarrow_forward
- The NJ Department of Health has reported the average life span of NJ residents is 81 years. If the standard deviation is σ = 4 years, what is the probability of a person living to at least 92 years of age?arrow_forwardAssume that adults have IQ scores that are normally distributed with a mean of µ = 105 and a standard deviation o = 20. Find the probability that a randomly selected adult has an IQ between 85 and 125. Click to view page 1 of the table. Click to view page 2 of the table. ... The probability that a randomly selected adult has an IQ between 85 and 125 is (Type an integer or decimal rounded to four decimal places as needed.)arrow_forwardSuppose baby kittens' weights are normally distributed with a mean of 11.4 and a standard deviation of 2.1. The Z-score tells you how many units above the average (if Z-score is positive) or below the average (if Z- Score is negative) any particular baby kitten's weight is. Find the baby kitten weight that corresponds to the following Z-scores. Use the formula Z where u is the mean, o is the standard deviation, and X is the baby kitten weight. a. Z = = 0.07, X = b. Z = 1.63, X =arrow_forward
- Assume that the readings on the thermometers are normally distributed with a mean of 0° and standard deviation of 1.00°C. A thermometer is randomly selected and tested. Draw a sketch and find the temperature reading corresponding to P34, the 84th percentile. This is the temperature reading separating the bottom 84% from the top 16%. Click to view page 1 of the table. Click to view page 2 of the table. Which graph represents P ? Choose the correct graph below. 84 A. В. OC. D. Ay X The temperature for P84 is approximately (Round to two decimal places as needed.)arrow_forwardThe distances golf balls travel under laboratory testing conditions are normally distributed. The mean is 312 yards. The probability the golf ball travels further than 319 yards is 0.28. Find the probability a randomly selected golf ball travels between 305 yards and 319 yards. Express the answer as a decimal value rounded to the nearest hundredth.arrow_forward
arrow_back_ios
arrow_forward_ios
Recommended textbooks for you
- MATLAB: An Introduction with ApplicationsStatisticsISBN:9781119256830Author:Amos GilatPublisher:John Wiley & Sons Inc
 Probability and Statistics for Engineering and th...StatisticsISBN:9781305251809Author:Jay L. DevorePublisher:Cengage Learning
 Statistics for The Behavioral Sciences (MindTap C...StatisticsISBN:9781305504912Author:Frederick J Gravetter, Larry B. WallnauPublisher:Cengage Learning
  Elementary Statistics: Picturing the World (7th E...StatisticsISBN:9780134683416Author:Ron Larson, Betsy FarberPublisher:PEARSON
 The Basic Practice of StatisticsStatisticsISBN:9781319042578Author:David S. Moore, William I. Notz, Michael A. FlignerPublisher:W. H. Freeman
 Introduction to the Practice of StatisticsStatisticsISBN:9781319013387Author:David S. Moore, George P. McCabe, Bruce A. CraigPublisher:W. H. Freeman
MATLAB: An Introduction with Applications
Statistics
ISBN:9781119256830
Author:Amos Gilat
Publisher:John Wiley & Sons Inc
Probability and Statistics for Engineering and th...
Statistics
ISBN:9781305251809
Author:Jay L. Devore
Publisher:Cengage Learning
Statistics for The Behavioral Sciences (MindTap C...
Statistics
ISBN:9781305504912
Author:Frederick J Gravetter, Larry B. Wallnau
Publisher:Cengage Learning
Elementary Statistics: Picturing the World (7th E...
Statistics
ISBN:9780134683416
Author:Ron Larson, Betsy Farber
Publisher:PEARSON
The Basic Practice of Statistics
Statistics
ISBN:9781319042578
Author:David S. Moore, William I. Notz, Michael A. Fligner
Publisher:W. H. Freeman
Introduction to the Practice of Statistics
Statistics
ISBN:9781319013387
Author:David S. Moore, George P. McCabe, Bruce A. Craig
Publisher:W. H. Freeman