
MATLAB: An Introduction with Applications
6th Edition
ISBN: 9781119256830
Author: Amos Gilat
Publisher: John Wiley & Sons Inc
expand_more
expand_more
format_list_bulleted
Related questions
Question
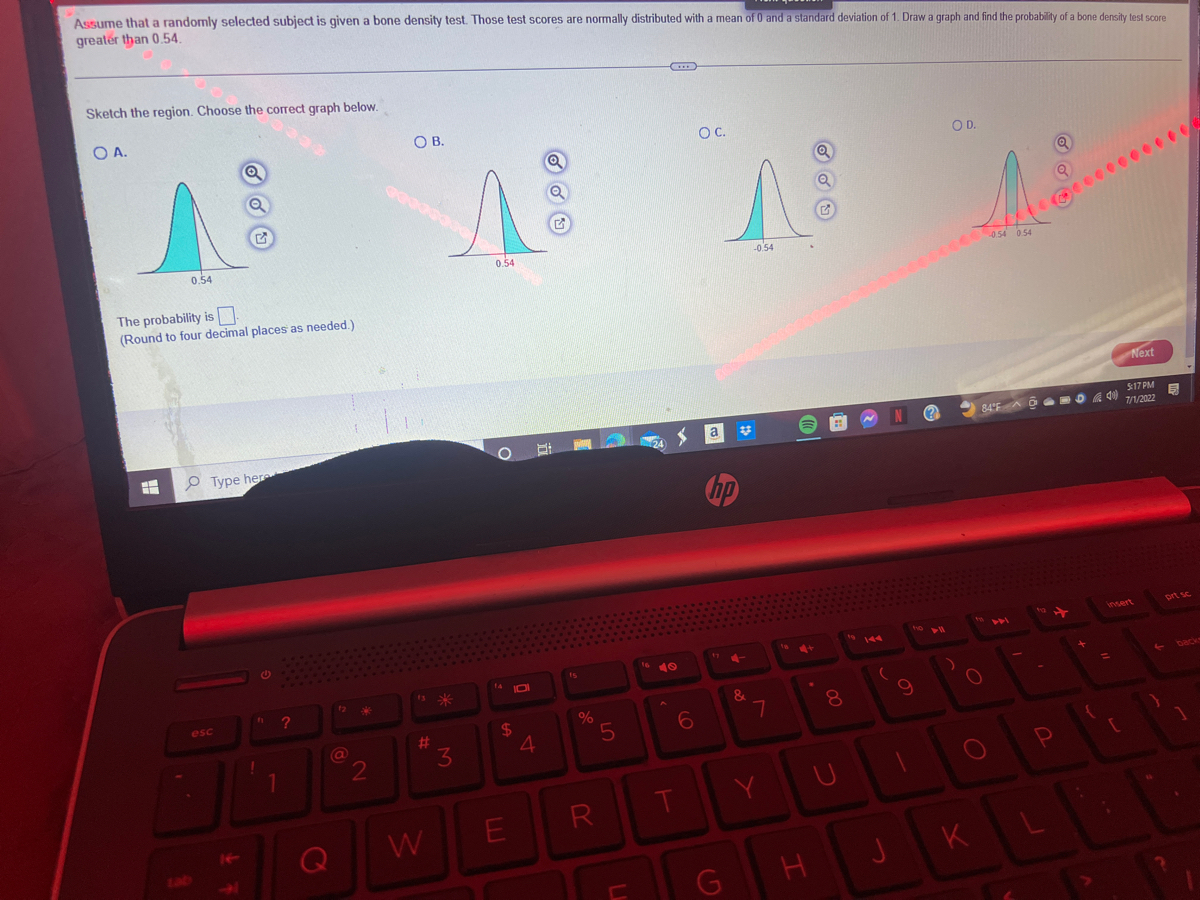

Transcribed Image Text:Assume that a randomly selected subject is given a bone density test. Those test scores are normally distributed with a mean of 0 and a standard deviation of 1. Draw a graph and find the probability of a bone density test score
greater than 0.54.
Sketch the region. Choose the correct graph below.
OA.
A
0.54
H
Q
The probability is
(Round to four decimal places as needed.)
esc
Q
Type here
le
G
f ?
1
12
@
Q
2
O B.
#
W
3
Q
1 &
0.54
O
101
$
E
4
%
5
R
U
<
6
T
O C.
a
hp
Ę
17 4-
G
&
-0.54
7
Y
H
21
00
8
U
N
(
J
N
9
1
??
OD.
)
A
-0.54 0.54
O
O
K
84°F AMD A
6
4)
Q
P
Q
+
=
Next
insert
(
5:17 PM
7/1/2022
5
prt sc
back
Expert Solution
This question has been solved!
Explore an expertly crafted, step-by-step solution for a thorough understanding of key concepts.

Step by stepSolved in 3 steps with 2 images

Knowledge Booster

Similar questions
- Assume that a randomly selected subject is given a bone density test. Those test scores are normally distributed with a mean of 0 and a standard deviation of 1. Find the probability that a given score is between - 2.18 and 3.86 and draw a sketch of the region. Sketch the region. Choose the correct graph below. O A. В. OC. O D. -2.18 3.86 2.18 3.86 -2.18 3.86 -2.18 3.86 The probability is (Round to four decimal places as needed.) Click to select your answer(s). 山T00④ NOV 2. 1377 14 X P W MacBook Air esc 80 888 F3 F4 F7 FB F9 F10 $4 & 4 80 Q E Y A F G H. K /2x cv C V B D. 林 wwww wwwwwarrow_forward← Assume that a randomly selected subject is given a bone density test. Those test scores are normally distributed with a mean of 0 and a standard deviation of 1. Find the probability that a given score is between - 2.01 and 3.94 and draw a sketch of the region. Sketch the region. Choose the correct graph below. O A. -2.01 O B. Q Search 3.94 2.01 3.9₁ The probability is. (Round to four decimal places as needed.) ↓ ▶ O C. -2.01 3.9< O D. ✪ Time Remaining: 00:58:20 PrtScn Recording Session -2.01 Next Home 3.94 Evit Honorlararrow_forwardi need the answer quicklyarrow_forward
- Engineers want to design seats in commercial aircraft so that they are wide enough to fit 99% of all males. (Accommodating 100% of males would require very wide seats that would be much too expensive.) Men have hip breadths that are normally distributed with a mean of 14.9 in. and a standard deviation of 0.9 in. Find Pog- That is, find the hip breadth for men that separates the smallest 99% from the largest 1%. The hip breadth for men that separates the smallest 99% from the largest 1% is Pgg = in. %3D (Round to one decimal place as needed.)arrow_forwardK mly selected subject is given a bone density test. Bone density test scores are normally distributed with a mean of 0 and a standard deviation of 1. Draw a graph and find P2. the 2nd percentile. This is the bone density score separating the bottom 2% from the top 98%. Which graph represents P₂? Choose the correct graph below. O A. OB. The bone density score corresponding to P₂ is. (Round to two decimal places as needed.) P₂ O C. P2 Q O D. P₂arrow_forwardAssume that a randomly selected subject is given a bone density test. Bone density test scores are normally distributed with a mean of 0 and a standard deviation of 1. Draw a graph and find P9, the 9th percentile. This is the bone density score separating the bottom 9% from the top 91%. Which graph represents P9? Choose the correct graph below.arrow_forward
- Assume that a randomly selected subject is given a bone density test. Those test scores are normally distributed with a mean of 0 and a standard deviation of 1. Draw a graph and find the probability of a bone density test score greater than 0.85. Question content area bottom Part 1 Sketch the region. Choose the correct graph below. A. -0.85 A symmetric bell-shaped curve is plotted over a horizontal axis. A vertical line segment runs from the horizontal axis to the curve at labeled coordinate negative 0.85, which is to the left of the curve’s center and peak. The area under the curve to the left of negative 0.85 is shaded. B. -0.850.85 A symmetric bell-shaped curve is plotted over a horizontal axis. Two vertical line segments run from the horizontal axis to the curve and are equidistant from the center and peak of the curve. One vertical line is at the labeled coordinate negative 0.85, which is to…arrow_forwardAssume that a randomly selected subject is given a bone density test. Those test scores are normally distributed with a mean of 0 and a standard deviation of 1. Draw a graph and find the probability of a bone density test score greater than 0. Sketch the region. Choose the correct graph below. O A. OB. C. ntents a Library The probability is (Round to four decimal places as needed.) Enter your answer in the answer box and then click Check Answer All parts showing Clear All Check Anwrarrow_forwardAssume that a randomly selected subject is given a bone density test. Those test scores are normally distributed with a mean of 0 and a standard deviation of 1. Draw a graph and find the probability of a bone density test score greater than - 1.59. Sketch the region. Choose the correct graph below. OA. -1.59 B. Q C. AAAA -1.59 1.59 ... The probability is (Round to four decimal places as needed.) S O D. 1,59 -1.59arrow_forward
- Assume that a randomly selected subject is given a bone density test. Those test scores are normally distributed with a mean of 0 and a standard deviation of 1. Draw a graph and find the probability of a bone density test score greater than 0.42. Sketch the region. Choose the correct graph below. OA. Λ -0.42 The probability is (Round to four decimal places as needed.) A O D. ○ C. Q 0.42 -0.42 0.42 0.42arrow_forwardAssume that a randomly selected subject is given a bone density test. Those test scores are normally distributed with a mean of 0 and a standard deviation of 1. Draw a graph and find the probability of a bone density test score greater than -3.71. Sketch the region. Choose the correct graph below. OA. 3.71 Q B. -3.71 The probability of a bone density test score greater than -3.71 is ☐. (Round to four decimal places as needed.) ๘ ๘ ปี OC. OD. Л 3.71 3.71arrow_forwardAssume that a randomly selected subject is given a bone density test. Those test scores are normally distributed with a mean of 0 and a standard deviation of 1. Find the probability that a given score is between -2.18 and 3.97 and draw a sketch of the region. Sketch the region. Choose the correct graph below. OA. -2.18 E 3.97 The probability is (Round to four decimal places as needed.) esc Q G Type here tab If 1 2 000000 1 @ Q 2 O B. ^ # W 3 S 2.18 3.97 $ E S Q 4 G % 5 R F LL S OC. T A -2.18 3.92 6 hp 4 4- & G 7 Y + H B 8 U 144 ( 9 1 J N D OD. 84°F O K Q .......... M A MH S 3.97 a + 440) { A = Next 5:19 PM 7/1/2022 insert [ prt scarrow_forward
arrow_back_ios
arrow_forward_ios
Recommended textbooks for you
- MATLAB: An Introduction with ApplicationsStatisticsISBN:9781119256830Author:Amos GilatPublisher:John Wiley & Sons Inc
 Probability and Statistics for Engineering and th...StatisticsISBN:9781305251809Author:Jay L. DevorePublisher:Cengage Learning
 Statistics for The Behavioral Sciences (MindTap C...StatisticsISBN:9781305504912Author:Frederick J Gravetter, Larry B. WallnauPublisher:Cengage Learning
  Elementary Statistics: Picturing the World (7th E...StatisticsISBN:9780134683416Author:Ron Larson, Betsy FarberPublisher:PEARSON
 The Basic Practice of StatisticsStatisticsISBN:9781319042578Author:David S. Moore, William I. Notz, Michael A. FlignerPublisher:W. H. Freeman
 Introduction to the Practice of StatisticsStatisticsISBN:9781319013387Author:David S. Moore, George P. McCabe, Bruce A. CraigPublisher:W. H. Freeman
MATLAB: An Introduction with Applications
Statistics
ISBN:9781119256830
Author:Amos Gilat
Publisher:John Wiley & Sons Inc
Probability and Statistics for Engineering and th...
Statistics
ISBN:9781305251809
Author:Jay L. Devore
Publisher:Cengage Learning
Statistics for The Behavioral Sciences (MindTap C...
Statistics
ISBN:9781305504912
Author:Frederick J Gravetter, Larry B. Wallnau
Publisher:Cengage Learning
Elementary Statistics: Picturing the World (7th E...
Statistics
ISBN:9780134683416
Author:Ron Larson, Betsy Farber
Publisher:PEARSON
The Basic Practice of Statistics
Statistics
ISBN:9781319042578
Author:David S. Moore, William I. Notz, Michael A. Fligner
Publisher:W. H. Freeman
Introduction to the Practice of Statistics
Statistics
ISBN:9781319013387
Author:David S. Moore, George P. McCabe, Bruce A. Craig
Publisher:W. H. Freeman