
MATLAB: An Introduction with Applications
6th Edition
ISBN: 9781119256830
Author: Amos Gilat
Publisher: John Wiley & Sons Inc
expand_more
expand_more
format_list_bulleted
Related questions
Question
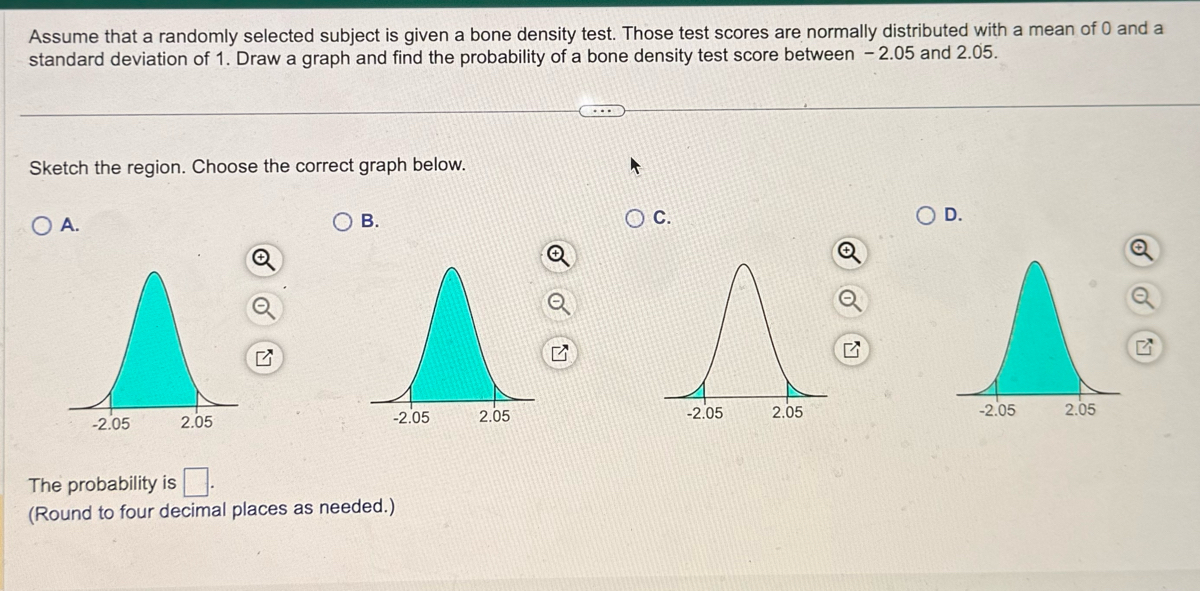

Transcribed Image Text:Assume that a randomly selected subject is given a bone density test. Those test scores are normally distributed with a mean of 0 and a
standard deviation of 1. Draw a graph and find the probability of a bone density test score between -2.05 and 2.05.
Sketch the region. Choose the correct graph below.
O A.
-2.05
2.05
OB.
The probability is
(Round to four decimal places as needed.)
A
© C.
OD.
Q
-2.05
2.05
-2.05
2.05
E
-2.05
2.05
G
Expert Solution
This question has been solved!
Explore an expertly crafted, step-by-step solution for a thorough understanding of key concepts.

Step by stepSolved in 2 steps with 2 images

Knowledge Booster

Similar questions
- Q1arrow_forwardAssume that a randomly selected subject is given a bone density test. Those test scores are normally distributed with a mean of 0 and a standard deviation of 1. Find the probability that a given score is less than 1.94 and draw a sketch of the region. Sketch the region. Choose the correct graph below. O A. O B. С. O D. 1.94 -1.94 1.94 -1.94 1.94 The probability is (Round to four decimal places as needed.)arrow_forwardAssume that a randomly selected subject is given a bone density test. Those test scores are normally distributed with a mean of 0 and a standard deviation of 1. Find the probability that a given score is less than -0.72 and draw a sketch of the region. Sketch the region. Choose the correct graph below. O A. В. Oc. OD. -0.72 0.72 -0.72 0.72 -0.72 The probability is (Round to four decimal places as needed.) Click to select your answer(s). ? 1377 PAGES NOV W 14 3D MacBook Air DII 80 888 F10 F8 F9 F5 F6 F7 F4 * % 4 5 7 くO ...·arrow_forward
- Assume that a randomly selected subject is given a bone density test. Those test scores are normally distributed with a mean of 0 and a standard deviation of 1. Find the probability that a given score is less than - 1.08 and draw a sketch of the region. Sketch the region. Choose the correct graph below. O A. В. C. D. -1.08 -1.08 -1.08 1.08 1.08 The probability is (Round to four decimal places as needed.)arrow_forwardAssume that a randomly selected subject is given a bone density test. Those test scores are normally distributed with a mean of 0 and a standard deviation of 1. Find the probability that a given score is less than - 1.58 and draw a sketch of the region. Sketch the region. Choose the correct graph below. A. В. -1.58 -1.58 1.58 1.58 -1.58 The probability is: (Round to four decimal places as needed.)arrow_forwardWhich graph and probabilityarrow_forward
- ✅❎♦️♦️♦️❎❎❎♦️arrow_forwardAssume that a randomly selected subject is given a bone density test. Those test scores are normally distributed with a mean of 0 and a standard deviation of 1. Draw a graph and find the probability of a bone density test score greater than -1.62. Sketch the region. Choose the correct graph below. O A. 1.62 Q The probability is (Round to four decimal places as needed.) OB. Q -1.62 -1.62 ♫ OD. Q -1.62 1.62 Εarrow_forwardAssume that a randomly selected subject is given a bone density test. Those test scores are normally distributed with a mean of 0 and a standard deviation of 1. Draw a graph and find the probability of a bone density test score greater than - 1.89. Sketch the region. Choose the correct graph below. O A. OB. C. O D. 1,89 -1.89 -1.89 -1.89 1,89 The probability is (Round to four decimal places as needed.)arrow_forward
- Assume the readings on thermometers are normally distributed with a mean of 0°C and a standard deviation of 1.00°C. Find the probability that a randomly selected thermometer reads between -1.03 and -0.51 and draw a sketch of the region. Click to view page 1 of the table. Click to view page 2 of the table. Sketch the region. Choose the correct graph below. OA. -1.03 -0.51 Q The probability is (Round to four decimal places as needed.) O B. 4 -1.03 -0.51 Q G O C. A -1.03 -0.51arrow_forwardAssume that a randomly selected subject is given a bone density test. Those test scores are normally distributed with a mean of 0 and a standard deviation of 1. Find the probability that a given score is between - 2.18 and 3.86 and draw a sketch of the region. Sketch the region. Choose the correct graph below. O A. В. OC. O D. -2.18 3.86 2.18 3.86 -2.18 3.86 -2.18 3.86 The probability is (Round to four decimal places as needed.) Click to select your answer(s). 山T00④ NOV 2. 1377 14 X P W MacBook Air esc 80 888 F3 F4 F7 FB F9 F10 $4 & 4 80 Q E Y A F G H. K /2x cv C V B D. 林 wwww wwwwwarrow_forwardi need the answer quicklyarrow_forward
arrow_back_ios
SEE MORE QUESTIONS
arrow_forward_ios
Recommended textbooks for you
- MATLAB: An Introduction with ApplicationsStatisticsISBN:9781119256830Author:Amos GilatPublisher:John Wiley & Sons Inc
 Probability and Statistics for Engineering and th...StatisticsISBN:9781305251809Author:Jay L. DevorePublisher:Cengage Learning
 Statistics for The Behavioral Sciences (MindTap C...StatisticsISBN:9781305504912Author:Frederick J Gravetter, Larry B. WallnauPublisher:Cengage Learning
  Elementary Statistics: Picturing the World (7th E...StatisticsISBN:9780134683416Author:Ron Larson, Betsy FarberPublisher:PEARSON
 The Basic Practice of StatisticsStatisticsISBN:9781319042578Author:David S. Moore, William I. Notz, Michael A. FlignerPublisher:W. H. Freeman
 Introduction to the Practice of StatisticsStatisticsISBN:9781319013387Author:David S. Moore, George P. McCabe, Bruce A. CraigPublisher:W. H. Freeman
MATLAB: An Introduction with Applications
Statistics
ISBN:9781119256830
Author:Amos Gilat
Publisher:John Wiley & Sons Inc
Probability and Statistics for Engineering and th...
Statistics
ISBN:9781305251809
Author:Jay L. Devore
Publisher:Cengage Learning
Statistics for The Behavioral Sciences (MindTap C...
Statistics
ISBN:9781305504912
Author:Frederick J Gravetter, Larry B. Wallnau
Publisher:Cengage Learning
Elementary Statistics: Picturing the World (7th E...
Statistics
ISBN:9780134683416
Author:Ron Larson, Betsy Farber
Publisher:PEARSON
The Basic Practice of Statistics
Statistics
ISBN:9781319042578
Author:David S. Moore, William I. Notz, Michael A. Fligner
Publisher:W. H. Freeman
Introduction to the Practice of Statistics
Statistics
ISBN:9781319013387
Author:David S. Moore, George P. McCabe, Bruce A. Craig
Publisher:W. H. Freeman