
MATLAB: An Introduction with Applications
6th Edition
ISBN: 9781119256830
Author: Amos Gilat
Publisher: John Wiley & Sons Inc
expand_more
expand_more
format_list_bulleted
Related questions
Question
thumb_up100%
Answer correctly and read the questions corretly, take your time do not rush, this is all one quesiton if done correclty and organized I will write a very nice review about you!
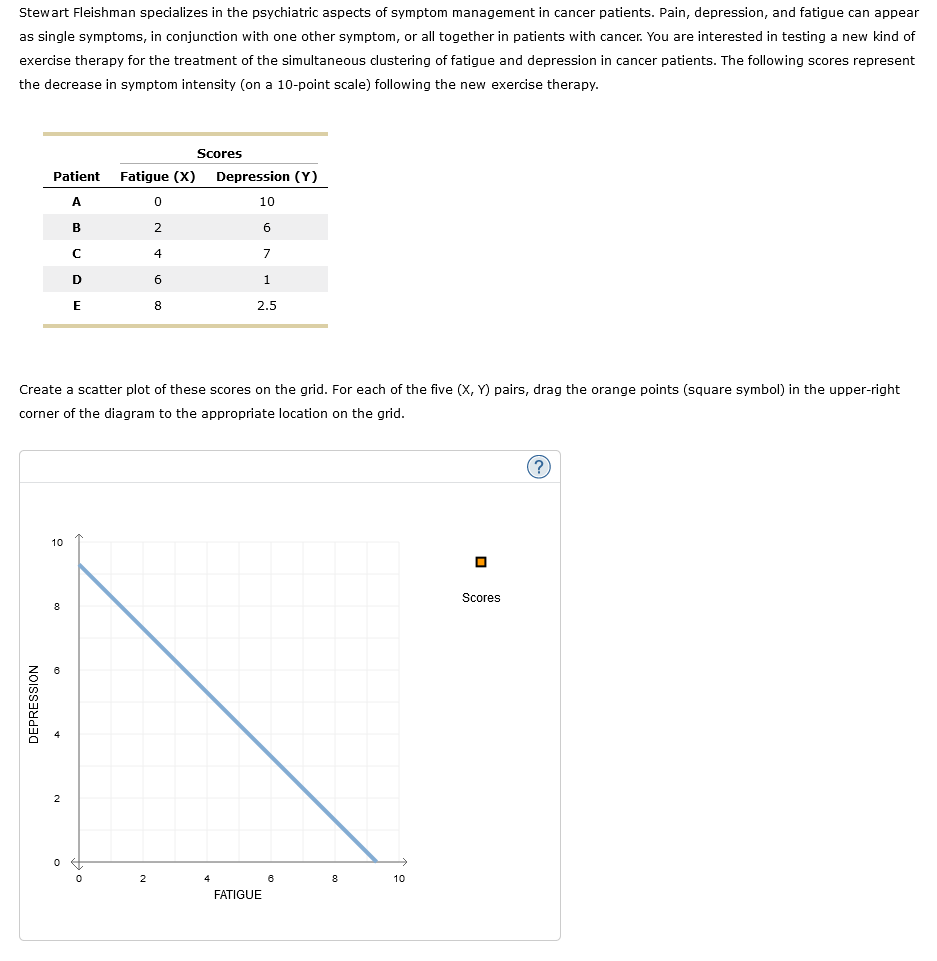

Transcribed Image Text:Stewart Fleishman specializes in the psychiatric aspects of symptom management in cancer patients. Pain, depression, and fatigue can appear
as single symptoms, in conjunction with one other symptom, or all together in patients with cancer. You are interested in testing a new kind of
exercise therapy for the treatment of the simultaneous clustering of fatigue and depression in cancer patients. The following scores represent
the decrease in symptom intensity (on a 10-point scale) following the new exercise therapy.
DEPRESSION
Patient Fatigue (X) Depression (Y)
A
0
10
B
6
с
7
D
1
E
2.5
Create a scatter plot of these scores on the grid. For each of the five (X, Y) pairs, drag the orange points (square symbol) in the upper-right
corner of the diagram to the appropriate location on the grid.
10
0
Scores
2
4
6
8
2
4
FATIGUE
6
8
10
0
Scores
(?)

Transcribed Image Text:Calculate the means and complete the following table by calculating the deviations from the means for X and Y, the squares of the deviations, and
the products of the deviations.
Scores
Y
10
X
0
2
4
6
8
6
7
1
2.5
Deviations
X - MX Y - My
-2.00
2.00
0.70
Ży
-4.30
Squared Deviations
=
(X - MX)²
4.00
4.00
(Y - My)²
0.49
Calculate the sum of the products and the sum of squares for X. SP =
18.49
ZX
Products
(X - MX)(Y - My)
Find the regression line for predicting Y given X. The slope of the regression line is
-1.40
-8.60
Calculate the standard error of the estimate. The standard error of the estimate is
Calculate the Pearson correlation coefficient, the predicted variability, and the unpredicted variability. The Pearson correlation is r =
The predicted variability is SSregression =
. The unpredicted variability is SS residual =
and SSX =
Suppose you want to predict the depression score for a new patient. The only information given is that this new patient is similar to patients A
through E; therefore, your best guess for the new patient's level of depression is
. The error associated with this guess (that is,
the "standard" amount your guess will be away from the true value) is
and the Y intercept is
Suppose that now you are told the fatigue score for this new patient is 5.5. Now your best guess for the new patient's level of depression is
The error associated with this guess (that is, the "standard" amount your guess will be away from the true value) is
Finally, suppose before estimating the regression equation, you first transform each of the original scores into a z-score. The regression equation
you estimate is:
Expert Solution
This question has been solved!
Explore an expertly crafted, step-by-step solution for a thorough understanding of key concepts.

Step by stepSolved in 6 steps with 1 images

Knowledge Booster

Similar questions
arrow_back_ios
arrow_forward_ios
Recommended textbooks for you
- MATLAB: An Introduction with ApplicationsStatisticsISBN:9781119256830Author:Amos GilatPublisher:John Wiley & Sons Inc
 Probability and Statistics for Engineering and th...StatisticsISBN:9781305251809Author:Jay L. DevorePublisher:Cengage Learning
 Statistics for The Behavioral Sciences (MindTap C...StatisticsISBN:9781305504912Author:Frederick J Gravetter, Larry B. WallnauPublisher:Cengage Learning
  Elementary Statistics: Picturing the World (7th E...StatisticsISBN:9780134683416Author:Ron Larson, Betsy FarberPublisher:PEARSON
 The Basic Practice of StatisticsStatisticsISBN:9781319042578Author:David S. Moore, William I. Notz, Michael A. FlignerPublisher:W. H. Freeman
 Introduction to the Practice of StatisticsStatisticsISBN:9781319013387Author:David S. Moore, George P. McCabe, Bruce A. CraigPublisher:W. H. Freeman
MATLAB: An Introduction with Applications
Statistics
ISBN:9781119256830
Author:Amos Gilat
Publisher:John Wiley & Sons Inc
Probability and Statistics for Engineering and th...
Statistics
ISBN:9781305251809
Author:Jay L. Devore
Publisher:Cengage Learning
Statistics for The Behavioral Sciences (MindTap C...
Statistics
ISBN:9781305504912
Author:Frederick J Gravetter, Larry B. Wallnau
Publisher:Cengage Learning
Elementary Statistics: Picturing the World (7th E...
Statistics
ISBN:9780134683416
Author:Ron Larson, Betsy Farber
Publisher:PEARSON
The Basic Practice of Statistics
Statistics
ISBN:9781319042578
Author:David S. Moore, William I. Notz, Michael A. Fligner
Publisher:W. H. Freeman
Introduction to the Practice of Statistics
Statistics
ISBN:9781319013387
Author:David S. Moore, George P. McCabe, Bruce A. Craig
Publisher:W. H. Freeman