
MATLAB: An Introduction with Applications
6th Edition
ISBN: 9781119256830
Author: Amos Gilat
Publisher: John Wiley & Sons Inc
expand_more
expand_more
format_list_bulleted
Related questions
Concept explainers
Topic Video
Question
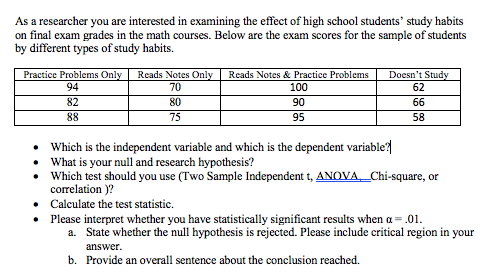

Transcribed Image Text:As a researcher you are interested in examining the effect of high school students' study habits
on final exam grades in the math courses. Below are the exam scores for the sample of students
by different types of study habits.
Practice Problems Only
94
Reads Notes Only
70
Doesn't Study
62
Reads Notes & Practice Problems
100
82
80
90
66
88
75
95
58
• Which is the independent variable and which is the dependent variable?
What is your null and research hypothesis?
• Which test should you use (Two Sample Independent t, ANOVA_Chi-square, or
correlation )?
• Calculate the test statistic.
Please interpret whether you have statistically significant results when a = .01.
a. State whether the null hypothesis is rejected. Please include critical region in your
answer.
b. Provide an overall sentence about the conclusion reached.
Expert Solution
This question has been solved!
Explore an expertly crafted, step-by-step solution for a thorough understanding of key concepts.

This is a popular solution

Trending nowThis is a popular solution!

Step by stepSolved in 2 steps with 3 images

Knowledge Booster


Learn more about
Need a deep-dive on the concept behind this application? Look no further. Learn more about this topic, statistics and related others by exploring similar questions and additional content below.Similar questions
- The Bureau of Labor Statistics reports that the official unemployment rate for Black people was 10.4% and 4.7% for White people in February 2015. Select all correct answers for this question. O The samples of white and black people are independent. The explanatory variable is the unemployment rate. The response variable is the unemployment rate. The response variable is race.arrow_forwardSuppose you were to collect data for the following pair of variables, ski diving: depth, visibility. You want to make a scatterplot. Which variable would you use as the explanatory variable? depth visibility Which variable would you use as the response variable? O depth O visibility Would you expect to see a positive or negative association? positive negative O neitherarrow_forwardWhich of the following variables is not a qualitative or categorical variable? Species: Warbler, Wren, Owl, etc. Moth Type: 1 = Peppered, 2 = Melanic Moth Type: 1 = Peppered, 2 = Melanic Age at Death: 0-116arrow_forward
- Provide an appropriate response. Suppose you were to collect data for the pair of given variables in order to make a scatterplot. For the variables time spent on homework and exam grade, which is more naturally the response variable and which is the explanatory variable? O Time spent on homework: response variable Exam grade: explanatory variable O Time spent on homework: explanatory variable Exam grade: response variablearrow_forwardIn a few sentences come up with your own idea for either an experimental OR observational study. Why would this study be either experimental or observational? Identify the explanatory and response variablesarrow_forwardFor an experiment comparing two methods of teaching social skills training to autistic children, the independent variable is and the dependent variable is Question 11 options: teaching methods; the autistic children the autistic children; the social skills that are learned the social skills that are learned; the autistic children teaching methods; the social skills that are learnedarrow_forward
arrow_back_ios
arrow_forward_ios
Recommended textbooks for you
- MATLAB: An Introduction with ApplicationsStatisticsISBN:9781119256830Author:Amos GilatPublisher:John Wiley & Sons Inc
 Probability and Statistics for Engineering and th...StatisticsISBN:9781305251809Author:Jay L. DevorePublisher:Cengage Learning
 Statistics for The Behavioral Sciences (MindTap C...StatisticsISBN:9781305504912Author:Frederick J Gravetter, Larry B. WallnauPublisher:Cengage Learning
  Elementary Statistics: Picturing the World (7th E...StatisticsISBN:9780134683416Author:Ron Larson, Betsy FarberPublisher:PEARSON
 The Basic Practice of StatisticsStatisticsISBN:9781319042578Author:David S. Moore, William I. Notz, Michael A. FlignerPublisher:W. H. Freeman
 Introduction to the Practice of StatisticsStatisticsISBN:9781319013387Author:David S. Moore, George P. McCabe, Bruce A. CraigPublisher:W. H. Freeman
MATLAB: An Introduction with Applications
Statistics
ISBN:9781119256830
Author:Amos Gilat
Publisher:John Wiley & Sons Inc
Probability and Statistics for Engineering and th...
Statistics
ISBN:9781305251809
Author:Jay L. Devore
Publisher:Cengage Learning
Statistics for The Behavioral Sciences (MindTap C...
Statistics
ISBN:9781305504912
Author:Frederick J Gravetter, Larry B. Wallnau
Publisher:Cengage Learning
Elementary Statistics: Picturing the World (7th E...
Statistics
ISBN:9780134683416
Author:Ron Larson, Betsy Farber
Publisher:PEARSON
The Basic Practice of Statistics
Statistics
ISBN:9781319042578
Author:David S. Moore, William I. Notz, Michael A. Fligner
Publisher:W. H. Freeman
Introduction to the Practice of Statistics
Statistics
ISBN:9781319013387
Author:David S. Moore, George P. McCabe, Bruce A. Craig
Publisher:W. H. Freeman