MATLAB: An Introduction with Applications
6th Edition
ISBN: 9781119256830
Author: Amos Gilat
Publisher: John Wiley & Sons Inc
expand_more
expand_more
format_list_bulleted
Concept explainers
Question
H0 : =150.00 kPa
H1 :>150.00 kPa
b) α= 0.01;
sample variance : 1300 freq. table
sample deviation : 36.0555 freq. table

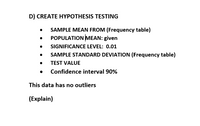
Transcribed Image Text:D) CREATE HYPOTHESIS TESTING
SAMPLE MEAN FROM (Frequency table)
POPULATION MEAN: given
SIGNIFICANCE LEVEL: 0.01
SAMPLE STANDARD DEVIATION (Frequency table)
TEST VALUE
Confidence interval 90%
This data has no outliers
(Explain)

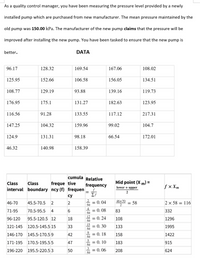
Transcribed Image Text:As a quality control manager, you have been measuring the pressure level provided by a newly
installed
dund
which are purchased from new manufacturer. The mean pressure maintained by the
old pump was 150.00 kPa. The manufacturer of the new pump claims that the pressure will be
improved after installing the new pump. You have been tasked to ensure that the new pump is
better.
DATA
96.17
128.32
169.54
167.06
108.02
125.95
152.66
106.58
156.05
134.51
108.77
129.19
93.88
139.16
119.73
176.95
175.1
131.27
182.63
123.95
116.56
91.28
133.55
117.12
217.31
147.25
104.32
159.96
99.02
104.7
124.9
131.31
98.18
66.54
172.01
46.32
140.98
158.39
cumula Relative
Mid point (X m) =
freque tive
interval boundary ncy (f) frequen
Class
Class
frequency
f x Xm
lower + upper
су
Ef
2
46+70
46-70
45.5-70.5
= 0. 04
50
= 58
2 x 58 = 116
2
4
71-95
70.5-95.5
= 0. 08
50
83
332
12
96-120
95.5-120.5 12
18
= 0. 24
50
108
1296
15
121-145
120.5-145.5 15
33
= 0. 30
50
133
1995
9
146-170
= 0. 18
50
158
1422
145.5-170.5 9
42
5
171-195
170.5-195.5 5
47
= 0. 10
50
183
915
196-220
195.5-220.5 3
50
3
0.06
208
624
50
II
Expert Solution
This question has been solved!
Explore an expertly crafted, step-by-step solution for a thorough understanding of key concepts.
Step by stepSolved in 4 steps

Knowledge Booster
Learn more about
Need a deep-dive on the concept behind this application? Look no further. Learn more about this topic, statistics and related others by exploring similar questions and additional content below.Similar questions
- Total plasma volume is important in determining the required plasma component in blood replacement therapy for a person undergoing surgery. Plasma volume is influenced by the overall health and physical activity of an individual. Suppose that a random sample of 50 male firefighters are tested and that they have a plasma volume sample mean of x = 37.5 ml/kg (milliliters plasma per kilogram body weight). Assume that ? = 7.20 ml/kg for the distribution of blood plasma.arrow_forwardA Show Time Remaining A The body lengths of deer mice are known to vary approximately normally, with mean 86 mm and standard deviation 8 mm. A research group is interested whether vitamin supplements will increase deer mouse body length. They select a random sample of 100 deer mice from the population of all deer mice that would ever receive vitamin supplements and observe their body lengths. Suppose the sample mean is calculated as 87.2 mm. Let u be the mean body length of deer mice who receive vitamin supplements. Provide the null and alternative hypotheses most appropriate for this situation. O A. Ho: H = 86 vs. Ha: P> 86 B. Họ: H = 87.2 vs. Hạ: µ 87.2 Reset Selectionarrow_forwardA sample of 3 measurements are taken and recorded: a =8, y = 10 and z = 7 The sample mean is: x = = 8.33 Fill in the table below. aj (a; - x)2 Ex: 5.34 Ex: 5.34 Ex: 5.34 82 = (z-z)*+(y-a)* +(z-z) Ex: 5.34 (z-2)*+(y-z)* +(z-) = Ex: 5.34arrow_forward
- Measuring lung function: One of the measurements used to determine the health of a person's lungs is the amount of air a person can exhale under force in one second. This is called forced expiratory volume in one second, and is abbreviated FEV1. Assume the mean FEV1 for 10 -year-old boys is 2.1 liters and that the population standard deviation is =σ0.4 . A random sample of 35 10 -year-old boys who live in a community with high levels of ozone pollution are found to have a sample mean FEV1 of 1.98 liters. Can you conclude that the mean FEV1 in the high-pollution community differs from 2.1 liters? Use the =α0.10 level of significance and the P -value method with the TI-84 calculator. Part: 0 / 4 0 of 4 Parts Complete Part 1 of 4 State the appropriate null and alternate hypotheses. :H0 :H1 This hypothesis test is a ▼(Choose one) test.arrow_forwardClaim: The standard deviation of pulse rates of adult males is less than 10 bpm. For a random sample of 140 adult males, the pulse rates have a standard deviation of 9.3 bpm.arrow_forwardShoulder height is known to be normally distributed with a mean of 56.65 inches for males and 52.5 inches for females. The males vary with a standard deviation of 2.46 inches and females at 2.49 inches. find the z-score representing a male whose shoulder height is 49 inches a standardized curve N(0,1) is shown below use this information to find an equivalent shoulder height for females and explain the relevance of this value and shading in the context of the problemarrow_forward
- Pulse rates of adult men are approximately normal with a mean of 70 and a standard deviation of 8. Which choice correctly describes how to find the proportion of men that have a pulse rate greater than 78? (a) Find the area to the right of z = -1 under a standard normal curve. (b) Find the area to the right of z=1 under a standard normal curve. (c) Find the area to the left of z = 1 under a standard normal curve. (d) Find the area between z=-1 and z=1 under a standard normal curve. (e) None of the abovearrow_forwardTotal plasma volume is important in determining the required plasma component in blood replacement therapy for a person undergoing surgery. Plasma volume is influenced by the overall health and physical activity of an individual. Suppose that a random sample of 46 male firefighters are tested and that they have a plasma volume sample mean of x = 37.5 ml/kg (milliliters plasma per kilogram body weight). Assume that ? = 7.50 ml/kg for the distribution of blood plasma. d)Find the sample size necessary for a 99% confidence level with maximal margin of error E = 2.60 for the mean plasma volume in male firefighters. (Round up to the nearest whole number.) =__ male firefighters What price do farmers get for their watermelon crops? In the third week of July, a random sample of 45 farming regions gave a sample mean of x = $6.88 per 100 pounds of watermelon. Assume that ? is known to be $2.00 per 100 pounds. (a) Find a 90% confidence interval for the population mean price (per 100 pounds) that…arrow_forwardA normal distribution with a mean of 2mm and a standard deviation of 0.05mm a randomly generated number of 0.71 , need to calculate the standardised Z value, from my notes Z = (actual value - mean)/standard deviation. do i take the randomly generated number of 0.81 as the actual value ?arrow_forward
- Claim: The standard deviation of pulse rates of adult males is more than 12 bpm. For a random sample of 172 adult males, the pulse rates have a standard deviation of 11.5 bpm. Find the value of the test statistic?arrow_forwardScores on a standardized exam are normally distributed with a mean of 517 and a standard deviation of 60. The figure below shows the distribution of the scores on a standardized exam. Cal- culate the shaded area under the curve. Express your answer in decimal form accurate to at least two decimal places. Answer: 397 457 The Scores on a Standardized Exanarrow_forwardNewspaper Reading Times A survey taken several years ago found that the average time a person spent reading the local daily newspaper was 10.8 minutes. The standard deviation of the population was 3 minutes. To see whether the average time had changed since the newspaper's format was revised, the newspaper editor surveyed 40 individuals. The average time that the 40 people spent reading the paper was 12.4 minutes. At α=0.10 , is there a change in the average time an individual spends reading the newspaper? Find the 90% confidence interval of the mean. (a) State the hypothesis and identify the claim with the correct hypothesis. :H0 ▼(Choose one) :H1 ▼(Choose one) This hypothesis test is a ▼(Choose one) test. (b)Find the critical value(s). Round the answer to 2 decimal places, if necessary. Critical values: (c)Compute the test value. Round the answer to at least 2 decimal places, if necessary. z= (d)Make the decision.…arrow_forward
arrow_back_ios
SEE MORE QUESTIONS
arrow_forward_ios
Recommended textbooks for you
 MATLAB: An Introduction with ApplicationsStatisticsISBN:9781119256830Author:Amos GilatPublisher:John Wiley & Sons Inc
 Probability and Statistics for Engineering and th...StatisticsISBN:9781305251809Author:Jay L. DevorePublisher:Cengage Learning
 Statistics for The Behavioral Sciences (MindTap C...StatisticsISBN:9781305504912Author:Frederick J Gravetter, Larry B. WallnauPublisher:Cengage Learning
 Elementary Statistics: Picturing the World (7th E...StatisticsISBN:9780134683416Author:Ron Larson, Betsy FarberPublisher:PEARSON
 The Basic Practice of StatisticsStatisticsISBN:9781319042578Author:David S. Moore, William I. Notz, Michael A. FlignerPublisher:W. H. Freeman
 Introduction to the Practice of StatisticsStatisticsISBN:9781319013387Author:David S. Moore, George P. McCabe, Bruce A. CraigPublisher:W. H. Freeman

MATLAB: An Introduction with Applications
Statistics
ISBN:9781119256830
Author:Amos Gilat
Publisher:John Wiley & Sons Inc

Probability and Statistics for Engineering and th...
Statistics
ISBN:9781305251809
Author:Jay L. Devore
Publisher:Cengage Learning

Statistics for The Behavioral Sciences (MindTap C...
Statistics
ISBN:9781305504912
Author:Frederick J Gravetter, Larry B. Wallnau
Publisher:Cengage Learning

Elementary Statistics: Picturing the World (7th E...
Statistics
ISBN:9780134683416
Author:Ron Larson, Betsy Farber
Publisher:PEARSON

The Basic Practice of Statistics
Statistics
ISBN:9781319042578
Author:David S. Moore, William I. Notz, Michael A. Fligner
Publisher:W. H. Freeman

Introduction to the Practice of Statistics
Statistics
ISBN:9781319013387
Author:David S. Moore, George P. McCabe, Bruce A. Craig
Publisher:W. H. Freeman