
MATLAB: An Introduction with Applications
6th Edition
ISBN: 9781119256830
Author: Amos Gilat
Publisher: John Wiley & Sons Inc
expand_more
expand_more
format_list_bulleted
Related questions
Question
Please solve question 1 ASAP
Thanks
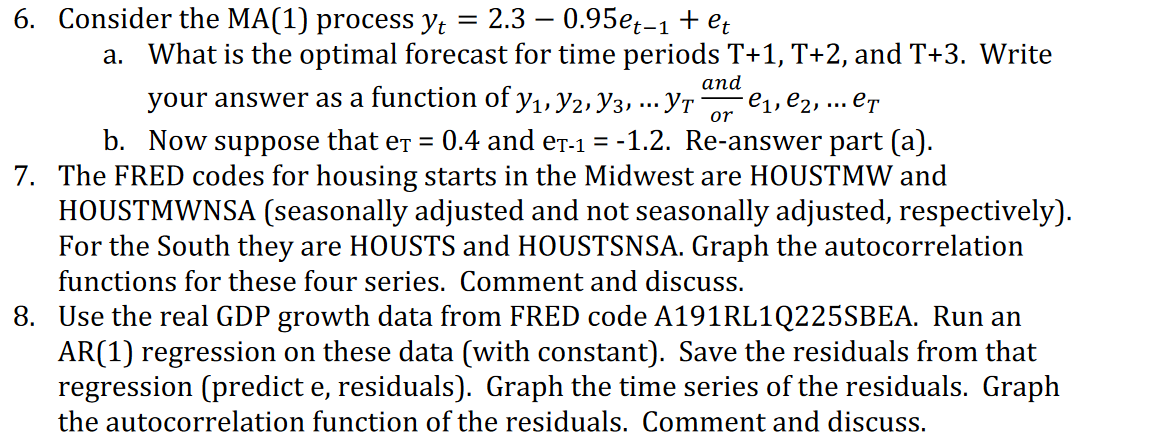

Transcribed Image Text:6. Consider the MA(1) process yt
2.3 — 0.95ер-1+ et
a. What is the optimal forecast for time periods T+1, T+2, and T+3. Write
аnd
your answer as a function of y1, y2, Y3, ... YT
e1, e2,
or
... eT
b. Now suppose that er = 0.4 and er-1 = -1.2. Re-answer part (a).
7. The FRED codes for housing starts in the Midwest are HOUSTMW and
HOUSTMWNSA (seasonally adjusted and not seasonally adjusted, respectively).
For the South they are HOUSTS and HOUSTSNSA. Graph the autocorrelation
functions for these four series. Comment and discuss.
8. Use the real GDP growth data from FRED code A191RL1Q225SBEA. Run an
AR(1) regression on these data (with constant). Save the residuals from that
regression (predict e, residuals). Graph the time series of the residuals. Graph
the autocorrelation function of the residuals. Comment and discuss.
Expert Solution
This question has been solved!
Explore an expertly crafted, step-by-step solution for a thorough understanding of key concepts.

This is a popular solution

Trending nowThis is a popular solution!

Step by stepSolved in 3 steps

Knowledge Booster

Similar questions
- Solve for the value of xarrow_forwardI need it written as 1 equationarrow_forwardMr. O'Dell and Mr. Johnson begin running laps around a one mile track at the same time. Mr. O'Dell completes a mile every 6 minutes and Mr. Johnson completes a mile every 8 minutes. How long will it take for them both to finish a lap at the same time?arrow_forward
arrow_back_ios
arrow_forward_ios
Recommended textbooks for you
- MATLAB: An Introduction with ApplicationsStatisticsISBN:9781119256830Author:Amos GilatPublisher:John Wiley & Sons Inc
 Probability and Statistics for Engineering and th...StatisticsISBN:9781305251809Author:Jay L. DevorePublisher:Cengage Learning
 Statistics for The Behavioral Sciences (MindTap C...StatisticsISBN:9781305504912Author:Frederick J Gravetter, Larry B. WallnauPublisher:Cengage Learning
  Elementary Statistics: Picturing the World (7th E...StatisticsISBN:9780134683416Author:Ron Larson, Betsy FarberPublisher:PEARSON
 The Basic Practice of StatisticsStatisticsISBN:9781319042578Author:David S. Moore, William I. Notz, Michael A. FlignerPublisher:W. H. Freeman
 Introduction to the Practice of StatisticsStatisticsISBN:9781319013387Author:David S. Moore, George P. McCabe, Bruce A. CraigPublisher:W. H. Freeman
MATLAB: An Introduction with Applications
Statistics
ISBN:9781119256830
Author:Amos Gilat
Publisher:John Wiley & Sons Inc
Probability and Statistics for Engineering and th...
Statistics
ISBN:9781305251809
Author:Jay L. Devore
Publisher:Cengage Learning
Statistics for The Behavioral Sciences (MindTap C...
Statistics
ISBN:9781305504912
Author:Frederick J Gravetter, Larry B. Wallnau
Publisher:Cengage Learning
Elementary Statistics: Picturing the World (7th E...
Statistics
ISBN:9780134683416
Author:Ron Larson, Betsy Farber
Publisher:PEARSON
The Basic Practice of Statistics
Statistics
ISBN:9781319042578
Author:David S. Moore, William I. Notz, Michael A. Fligner
Publisher:W. H. Freeman
Introduction to the Practice of Statistics
Statistics
ISBN:9781319013387
Author:David S. Moore, George P. McCabe, Bruce A. Craig
Publisher:W. H. Freeman