
MATLAB: An Introduction with Applications
6th Edition
ISBN: 9781119256830
Author: Amos Gilat
Publisher: John Wiley & Sons Inc
expand_more
expand_more
format_list_bulleted
Related questions
Question
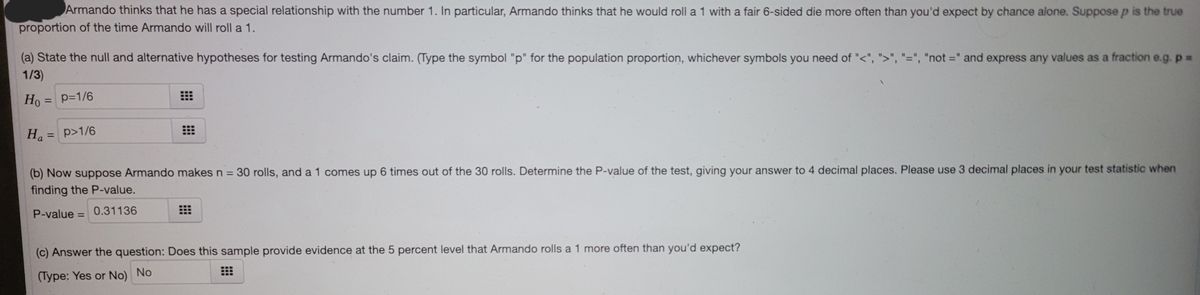

Transcribed Image Text:Armando thinks that he has a special relationship with the number 1. In particular, Armando thinks that he would roll a 1 with a fair 6-sided die more often than you'd expect by chance alone. Suppose p is the true
proportion of the time Armando will roll a 1.
(a) State the null and alternative hypotheses for testing Armando's claim. (Type the symbol "p" for the population proportion, whichever symbols you need of "<", ">", "=", "not =" and express any values as a fraction e.g. p 3D
1/3)
Ho = p=1/6
%3D
Ha
p>1/6
%3D
(b) Now suppose Armando makes n =
finding the P-value.
30 rolls, and a 1 comes up 6 times out of the 30 rolls. Determine the P-value of the test, giving your answer to 4 decimal places. Please use 3 decimal places in your test statistic when
P-value = 0.31136
%3D
(c) Answer the question: Does this sample provide evidence at the 5 percent level that Armando rolls a 1 more often than you'd expect?
(Type: Yes or No) No
Expert Solution
This question has been solved!
Explore an expertly crafted, step-by-step solution for a thorough understanding of key concepts.

Step by stepSolved in 3 steps with 2 images

Knowledge Booster

Similar questions
- According to the famous law of large numbers, the empirical a very large number of times. probability approaches the probabilitarrow_forwardPlease see below. I need help with the answers in the red boxes. Those came back wrong.arrow_forwardFor the situation described below, state the null hypothesis, Ho, and the alternative hypothesis, H, to be tested. (Enter != for # as needed.) A statistical test is designed to show that the proportionp of defectives has decreased below 0.6%. Ho: 0.6 H: 0.6arrow_forward
- Cody took his first physics exam and scored an 80. The population mean for this exam is 70, and the standard deviation is 5. What is the probability of selecting a person with a score greater than Cody’s?arrow_forwardAccording to Reader's Digest, 44% of primary care doctors think their patients receive unnecessary medical care. Use the z-table. a. Suppose a sample of 260 primary care doctors was taken. Show the sampling distribution of the proportion of the doctors who think their patients receive unnecessary medical care. E(p)= (to 2 decimals) (to 4 decimals) b. What is the probability that the sample proportion will be within ±0.03 of the population proportion? Round your answer to four decimals. c. What is the probability that the sample proportion will be within ±0.05 of the population proportion? Round your answer to four decimals. d. What would be the effect of taking a larger sample on the probabilities in parts (b) and (c)? Why? The probabilities would - Select your answer -increasedecreaseItem 5 . This is because the increase in the sample size makes the standard error, ,arrow_forwardA population proportion is 0.3. A sample of size 200 will be taken and the sample proportion will be used to estimate the population proportion. Use z-table. Round your answers to four decimal places. a. What is the probability that the sample proportion will be within ±0.03 of the population proportion? b. What is the probability that the sample proportion will be within ±0.05 of the population proportion?arrow_forward
arrow_back_ios
arrow_forward_ios
Recommended textbooks for you
- MATLAB: An Introduction with ApplicationsStatisticsISBN:9781119256830Author:Amos GilatPublisher:John Wiley & Sons Inc
 Probability and Statistics for Engineering and th...StatisticsISBN:9781305251809Author:Jay L. DevorePublisher:Cengage Learning
 Statistics for The Behavioral Sciences (MindTap C...StatisticsISBN:9781305504912Author:Frederick J Gravetter, Larry B. WallnauPublisher:Cengage Learning
  Elementary Statistics: Picturing the World (7th E...StatisticsISBN:9780134683416Author:Ron Larson, Betsy FarberPublisher:PEARSON
 The Basic Practice of StatisticsStatisticsISBN:9781319042578Author:David S. Moore, William I. Notz, Michael A. FlignerPublisher:W. H. Freeman
 Introduction to the Practice of StatisticsStatisticsISBN:9781319013387Author:David S. Moore, George P. McCabe, Bruce A. CraigPublisher:W. H. Freeman
MATLAB: An Introduction with Applications
Statistics
ISBN:9781119256830
Author:Amos Gilat
Publisher:John Wiley & Sons Inc
Probability and Statistics for Engineering and th...
Statistics
ISBN:9781305251809
Author:Jay L. Devore
Publisher:Cengage Learning
Statistics for The Behavioral Sciences (MindTap C...
Statistics
ISBN:9781305504912
Author:Frederick J Gravetter, Larry B. Wallnau
Publisher:Cengage Learning
Elementary Statistics: Picturing the World (7th E...
Statistics
ISBN:9780134683416
Author:Ron Larson, Betsy Farber
Publisher:PEARSON
The Basic Practice of Statistics
Statistics
ISBN:9781319042578
Author:David S. Moore, William I. Notz, Michael A. Fligner
Publisher:W. H. Freeman
Introduction to the Practice of Statistics
Statistics
ISBN:9781319013387
Author:David S. Moore, George P. McCabe, Bruce A. Craig
Publisher:W. H. Freeman