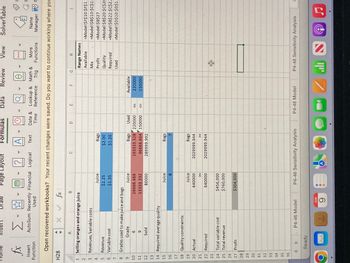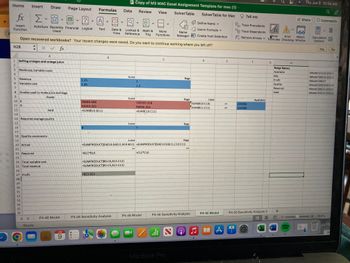
Are my formulas correct and did I get the correct answer?
Question: Sunblessed Juice Company sells bags of oranges and cartons of orange juice. Sunblessed grades oranges on a scale of 1 (poor) to 10 (excellent). At present, Sunblessed has 220,000 pounds of grade 6 oranges and 150,000 pounds of grade 9 oranges on hand. The aver- age quality of oranges sold in bags must be at least 7, and the average quality of the oranges used to produce orange juice must be at least 8. Each pound of oranges that is used for juice yields a revenue of $2.25 and in- curs a variable cost (consisting of labor costs, variable overhead costs, inventory costs, and so on) of $1.35. Each pound of oranges sold in bags yields a revenue of $2.00 and incurs a variable cost of $1.20.
a. Determine how Sunblessed can maximize its profit.


Trending nowThis is a popular solution!
Step by stepSolved in 2 steps with 3 images

- Boston Electric Generators has been getting many complaints from its major customer, Home Station, about the quality of its shipments of home generators. Daniel Shimshak, the plant manager, is alarmed that a customer is providing him with the only information the company has on shipment quality. He decides to collect information on defective shipments through a form he has asked his drivers to complete on arrival at customers' stores. The forms for the first 287 shipments have been turned in. They show the following over the past 8 weeks: Week No. of Shipments No. of Shipments with Defects 1 23 10 2 31 11 3 32 12 4 39 13 5 35 12 6 40 14 7 41 14 8 46 17 This exercise contains only part a. a) Using the point drawing tool eight times, develop a scatter diagram using total number of shipments and number of defective shipments. Part 2arrow_forwardS Book Hint Print eferences Problem 13-2 (Algo) A metal fabricator produces connecting rods with an outer diameter that has a 1 ± 0.02 inch specification. A machine operator takes several sample measurements over time and determines the sample mean outer diameter to be 1.004 inches with a standard deviation of 0.006 inch. Calculate the process capability index for this example. (Round your answer to 3 decimal places.) Process capability indexarrow_forwardProblem 13-4 (Algo) There is a 3 percent error rate at a specific point in a production process. If an inspector is placed at this point, all the defects can be detected and eliminated. The inspector would cost $11 per hour and could inspect units in the process at the current production rate of 52 per hour. If no inspector is hired and defects are allowed to pass this point, there is a cost of $12 per defective unit to correct the defects later on. Assume that the line will operate at the same rate (i.e., the current production rate) regardless of whether the inspector is hired or not. a. If an inspector is hired, what will be the inspection cost per unit? (Round your answer to 3 decimal places.) Cost per unit b. If an inspector is not hired, what will be the defective cost per unit? (Round your answer to 3 decimal places.) Cost per unitarrow_forward
- You are a food specialist in a company that specializes inrefrigerated delicacies, and one of your brands requires beingmaintained at a temperature of 5°C. You determine averagewater activity (aw) at this temperature to be 0.2. One day, you are informed that the cooling systems onone of the delivery trucks carrying your company’s productsmalfunctioned while en route to its destination and it would notbe fixed until the next delivery. The driver has informed you thatthe temperature in the delivery bay of the truck is averaging55°C. You estimate a heat of sorption (Q) of 19 kJ/mol. Calculate the water activity of the brand at this elevatedtemperature and comment on it’s integrity. Should the deliverystill push through? Or should the products be recalled anddisposedarrow_forwardThe International Organization for Standardization is the first globally recognized standard related to risk management: a) True b) Falsearrow_forwardNetwork Solutions, Inc, is an international company with their headquarters in Frankfurt, Germany and has branches in 120 countries in the world. Network Solution, Inc, is a worldwide leader in hardware, software and services essential to computer. Until recently, Network Solutions, Inc, used more than 50 different systems to measure performance within the firm, many employees did not receive a review. Fewer than 5% of all empolyees received the lowest category of ratings, and there was no recognition program in place to reward high achievers. Sales of computer hardware, and software started to decline so drastically from week to week, month to month and year to year in many outlets but they couldn't establish the reason behind the whole saga. Overall, it was discovered that performance problems were not being addressed, and tough pressure from competitors was increasing the costs of managing human performance ineffectively. In addition, quality initiatives were driving change in…arrow_forward
- a company makes a pair of shoes that can last for more than 10 years. Is this an advantage or disadvantage to customer?why do you think so?arrow_forwardConsider the following given below: Week Sales('000) 1. 39 44 40 4 45 38 43 39 What is the Mean Absolute Percent error (MAPE)?arrow_forwardASQ (The American Society for Quality) Defines a Six Sigma project as: Six Sigma is a method for reducing variation in manufacturing, service, or other business processes. Six Sigma projects measure the cost benefit of improving processes that are producing substandard products or services. Whether in manufacturing or service industries, such projects quantify the effect of process changes on delays or rework. The goal of each successful Six Sigma project is to produce statistically significant improvements in the target process; over time, multiple Six Sigma projects produce virtually defect-free performance. The Six Sigma Black Belt project is one that uses appropriate tools within a Six Sigma approach to produce breakthrough performance and real financial benefit to an operating business or company. The tools are generic. It is the structure of the project and the associated process (improvement model) that distinguish a Black Belt project from other similar quality improvement…arrow_forward
- When one of the company's products is introduced to the market, it is quickly discovered to have some consistency defects. How do you arrange consumer data (and what type of data) in order to determine the impact and cost of quality defects on this product model and the company?arrow_forwardCustomer Manufacturing Group (2010) Using Business Process Improvement Teams to Increase Customer Satisfaction and Improve Performance. A Customer Manufacturing Group Case Study [Online]. Available at: http://www.customermfg.com/wpfiles/csbpi.pdf (Links to an external site.) Question The case study from the Customer Manufacturing Group (2010) outlines the business process improvement that was undertaken within a company. Discuss what this case study demonstrates about how business process improvement should be taken within companies.arrow_forward1. Tabulate the differences and similarities between the compliance & choice safetym measuring device.arrow_forward
 Practical Management ScienceOperations ManagementISBN:9781337406659Author:WINSTON, Wayne L.Publisher:Cengage,
 Operations ManagementOperations ManagementISBN:9781259667473Author:William J StevensonPublisher:McGraw-Hill Education
 Operations and Supply Chain Management (Mcgraw-hi...Operations ManagementISBN:9781259666100Author:F. Robert Jacobs, Richard B ChasePublisher:McGraw-Hill Education
 Purchasing and Supply Chain ManagementOperations ManagementISBN:9781285869681Author:Robert M. Monczka, Robert B. Handfield, Larry C. Giunipero, James L. PattersonPublisher:Cengage Learning
 Production and Operations Analysis, Seventh Editi...Operations ManagementISBN:9781478623069Author:Steven Nahmias, Tava Lennon OlsenPublisher:Waveland Press, Inc.


